The “midterm curse” suggests the ruling party will likely struggle — and markets often feel the impact.
Most Americans probably spent Thanksgiving avoiding political conversations, but investors can’t ignore the political cycle ahead. With the 2026 U.S. midterm elections approaching next November, markets are once again entering a period of rising uncertainty.
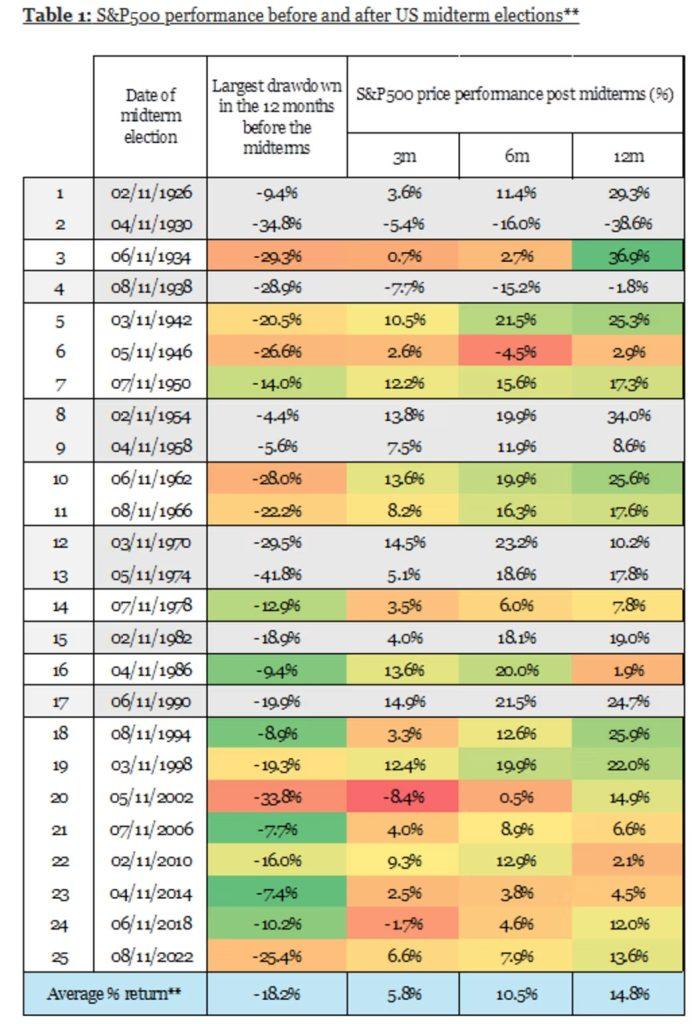
Harry Colvin, senior market strategist at Longview Economics, analyzed more than 100 years of market data to see how midterms typically influence stocks. His research shows a clear pattern: the S&P 500 often experiences a significant drawdown in the 12–18 months before a midterm election — a selloff that frequently becomes a prime buying opportunity. Once the election concludes, equities tend to rebound strongly over the following 3, 6, and 12 months.
Colvin says this pre-election volatility makes sense. Investors dislike uncertainty, especially when elections may result in policy gridlock or slower economic momentum. After the vote, uncertainty fades, policy direction becomes clearer, and markets shift their focus back to fundamentals.
This cycle could be more sensitive than usual. Investors aligned with the Trump administration’s agenda may view the outcome with extra caution given the historical trend: the president’s party almost always loses seats during midterms, particularly in the House — a pattern widely known as the “midterm curse.” Factors include voter fatigue, energized opposition turnout, and backlash to early-term policies.
Still, Colvin notes that historical patterns aren’t perfect. Pullbacks occur once or twice a year regardless of elections, and midterms that occur near recessions muddy the data. Of the 25 midterms over the past century, nine were within a year of a recession and excluded from his analysis.
Among the remaining 16 midterms, twelve were preceded by S&P 500 declines greater than 10% in the year before election day. Seven of those drops exceeded 20%, while five were between 10% and 20%. These pullbacks were typically followed by strong post-election rallies: on average, the S&P 500 climbed 5.8% in three months, 10.5% in six months, and 14.8% over a year. Larger pre-midterm drawdowns often led to stronger 12-month rebounds, though the correlation isn’t perfect.
In short, Colvin believes any volatility leading up to the 2026 midterms will likely offer attractive buying opportunities — assuming the U.S. avoids recession, which Longview currently expects. “We are overweight U.S. equities in our tactical portfolio,” he says.
John Paul is the founder of DayTradeToWin, a trading education and software company established in 2008, supporting traders worldwide. His expertise focuses on price action-based futures trading strategies and structured market analysis.
DayTradeToWin delivers trading education, indicators, and software tools designed to help traders apply disciplined, rule-based decision-making across global futures markets.
He is the creator of multiple trading methodologies, including the Sonic System, Atlas Line, and Trade Scalper, which help traders identify structured opportunities in markets such as the E-mini S&P 500 (ES), Nasdaq (NQ), crude oil (CL), and gold (GC).
Official website: https://daytradetowin.com