S&P 500
Market News

S&P 500 Correction or Asian Currency Meltdown Threatens Stability

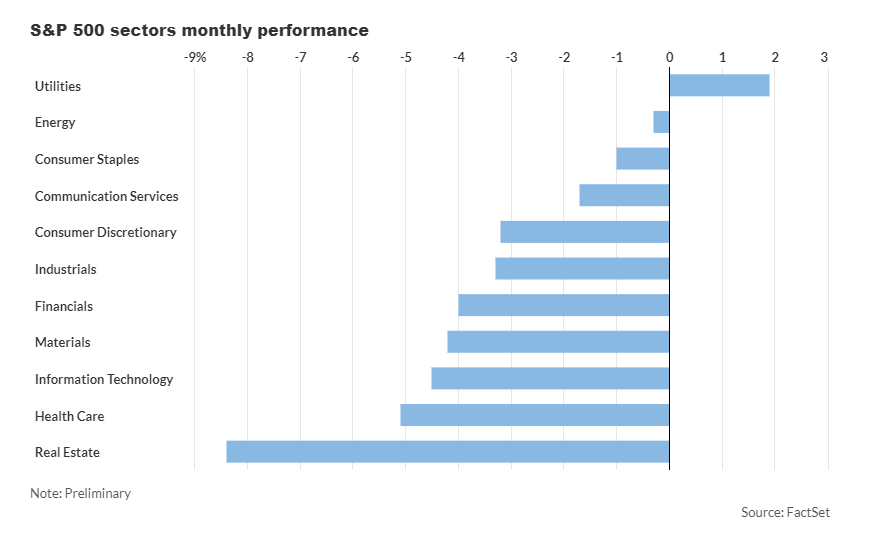
The early onset of Sell-in-May this year coincided with a sharp downturn in Tuesday’s trading, driven by yield fluctuations, bringing April’s market activity to a close. Stocks faltered ahead of an important Federal Reserve decision, compounded by disappointment from major players in the AI sector. In a recent communication to clients, Freya Beamish, TS Lombard’s head of macro research, raised concerns about an impending correction in the S&P 500 or the possibility of an Asian foreign exchange crisis. Beamish highlighted the growing disparities among major economies. While China, the European Central Bank, and the Bank of England are working to counteract the Fed’s anti-inflation measures to prevent currency devaluation, the Bank of Japan is focusing on stimulating its economy by controlling interest rates, although the yen continues to struggle. According to Beamish, pressure for currency depreciation will persist until the U.S. achieves equilibrium, with inflation ideally around 3% and sustained robust growth to support the global recovery narrative. A significant worry is the weakening U.S. job market, evidenced by various indicators such as deteriorating hiring plans for small businesses and a notable decline in the PMI’s employment index. While concrete data, notably the upcoming jobs report on Friday, may not yet reflect these warning signs, Beamish noted that independent surveys with a track record of predicting employment downturns are signaling trouble. Beamish suggests that leading indicators currently point to a period of sluggishness ahead, which could unsettle markets but also prompt the Fed to intervene, leading to a swift economic rebound. However, she emphasizes that Asian currencies depend on favorable U.S. data over the next few months to avoid further pressure on policymakers. Beamish underscores the delicate balance for Japan’s monetary policy, where misjudging U.S. inflation and job figures could result in slow rate adjustments. Additionally, she highlights the challenge for China’s PBOC in maintaining currency stability against a rising dollar, requiring positive U.S. economic indicators to mitigate strain. In conclusion, Beamish advises caution amidst increasing economic disparities, stressing the crucial role of U.S. data in shaping global financial dynamics in the coming months.

top traders
DayTradeToWin Review

Understanding Why Top Traders Ignore MACD

Greetings, fellow traders, and welcome back to our trading blog. As we embark on May 1st, I’m thrilled to discuss a strategy that has piqued my interest today – selling in the market. But before we delve into the details, let’s reiterate the cardinal rule of trading: it carries inherent risks. Only invest what you can afford to lose. Now that we’ve addressed that, let’s explore why today offers a compelling opportunity to sell. The Trade Scalper indicator is signaling a succession of short positions, closely followed by confirmation from the Atlas Line indicator. This convergence of disparate methods is a rare occurrence, signaling a clear trajectory. No reliance on moving averages or MACDs here – just unadulterated data pointing towards selling. The strength trades identified by the Atlas Line add an extra layer of assurance. When multiple indicators align, it’s a signal not to be ignored. Today, all indicators are pointing downwards, indicating a prime chance to capitalize on market fluctuations. Rather than swimming against the current, we’re harnessing the momentum of selling. If you’re tracking our Trade Scalper signals or have the Atlas Line at your disposal – or even better, both – it’s time to take action. Merge the insights from these indicators for a robust strategy. For those intrigued by the Atlas Line or Trade Scalper, contemplate joining our vibrant community of traders. We provide access to a live trading room and an accelerated mentorship program, bundling all our resources at a discounted rate. Don’t pass up on the opportunity to refine your trading skills. Before we conclude, I have some exciting news to share. Our software now seamlessly integrates with TradingView charts. Whether you’re already utilizing TradingView or contemplating it, this compatibility opens up new avenues for your trading journey. Refer to the links below to delve deeper. In conclusion, today’s market presents a clear signal – it’s time to sell. By aligning multiple indicators and leveraging strength trades, we can confidently seize this opportunity. Remember, trading is not a game of chance; it’s about strategic planning and well-informed decisions. Until our next update, happy trading!

Market News

10 S&P 500 Sectors Face Unprecedented Challenges in 2024

In April, U.S. stocks faced their toughest month of 2024, as ten out of the S&P 500 index’s 11 sectors saw significant declines. Both the S&P 500 index and the Nasdaq Composite experienced their first monthly drops since October, with decreases of 4.2% and 4.4% respectively. Investors grappled with concerns over persistent inflation, which tempered expectations of Federal Reserve interest-rate cuts, alongside a mix of first-quarter earnings reports and escalating tensions in the Middle East, contributing to market volatility. The Dow Jones Industrial Average also took a hit, marking its most substantial monthly decline by percentage since September 2022, according to Dow Jones Market Data. The real estate and healthcare sectors were among the hardest hit, with drops of 8.6% and 5.2% respectively. Real estate stocks suffered their worst month since September 2022, while the biotech, pharmaceuticals, and health insurance industries faced their most significant monthly declines since August 2022. The technology sector, including mega-cap tech names, witnessed steep declines, dragging down the broader market from previous record highs. Specifically, the information technology and communication services sectors saw drops of 5.5% and 2.2% respectively, marking their most substantial monthly declines since fall 2023. Meanwhile, the consumer discretionary sector fell by 4.4%, its worst month since October. At the beginning of 2024, investors had anticipated significant interest rate cuts by the central bank to alleviate price pressures. However, a series of unexpectedly high inflation data releases in April prompted a reassessment of rate cut timing, with some investors speculating that the first reduction might not occur until September or later in the year. This sentiment also triggered increases in Treasury bond yields alongside the U.S. dollar. The 2-year Treasury yield surged to 5.043%, its highest level since November, while the 10-year Treasury yield jumped 49.1 basis points to 4.683% in April, the most significant monthly increase since September 2022. The ICE U.S. Dollar Index, which measures the dollar’s strength against a basket of currencies, rose for a fourth consecutive month, climbing by 1.7% in April, its best performance since January and its longest winning streak since September 2022. Despite the overall market downturn, the utilities sector emerged as a bright spot, posting a 1.6% gain for the month. This marked the first time since October that the utilities sector was the sole monthly gainer, according to Dow Jones Market Data. As May begins, investors ponder the wisdom of the age-old Wall Street adage, “sell in May and go away,” which suggests a weaker period for stocks until late October. However, historical data, as popularized in the Stock Trader’s Almanac, indicates that November through April typically records the highest average price change for the S&P 500, while May through October tends to see weaker returns. Sam Stovall, chief investment strategist at CFRA Research, advises investors to consider rotating between stock sectors rather than completely exiting equity positions during this period. Historical data since 1990 suggests that sectors like consumer discretionary, industrials, materials, and technology outperform during the November-April period, while defensive sectors like consumer staples and healthcare fare better during May-October. Stovall highlights a hypothetical portfolio that rotates between these sectors, yielding higher returns and lower volatility compared to the benchmark S&P 500 index.

Market News

Why the Strong U.S. Dollar Hasn’t Dragged Down the Global Economy

Neil Shearing of Capital Economics contends that despite the vigorous surge of the U.S. dollar, the prospect of a succession of global currency crises appears remote. While the soaring dollar may unsettle global financial markets and raise concerns about currency stability for economies worldwide, Capital Economics suggests that the fallout may not be as dire as feared. The recent robust performance of the U.S. dollar, as evidenced by the ICE U.S. Dollar Index DXY, has been consistent, marking a four-month streak of gains. This strength mirrors the resilience of the U.S. economy, fueled by sustained domestic demand and persistent inflation, empowering the Federal Reserve to prolong higher interest rates and defer expectations of an initial rate reduction. Despite the advantages a strong dollar offers U.S. consumers, such as curbing inflation and facilitating cheaper international travel, it could present challenges abroad. Neil Shearing, Chief Economist at Capital Economics, warns that the inflationary pressure on imports due to a strong dollar might hinder global trade and economic activity, particularly for countries outside the United States. Furthermore, the appreciation of the dollar elevates the cost of dollar-denominated debts abroad, introducing uncertainty and potentially destabilizing financial markets. However, Shearing reassures that the recent ascent of the dollar has been gradual, minimizing the likelihood of triggering widespread currency crises in other nations. Moreover, the impact of a strong dollar on global inflation varies depending on several factors, including an economy’s import intensity and the magnitude of currency fluctuations. Contrary to conventional wisdom, Shearing observes an inverse correlation between the dollar’s strength and global import price inflation. This is largely due to the dollar’s influence on commodity prices, which tends to mitigate inflationary pressures. Additionally, while a robust dollar may dampen global trade, other factors often overshadow this effect in practical terms. Shearing’s analysis highlights the interplay between the dollar’s movements and changes in global GDP, suggesting that economic growth drives fluctuations in the greenback rather than the reverse. Consequently, while U.S. stocks were showing positive momentum during the time of his assessment, led by technology giants like Tesla and Apple, Shearing emphasizes the nuanced relationship between the dollar’s strength and broader economic dynamics.

DayTradeToWin Review

NASDAQ Trading Mastery with TradingView

Today, on April 29th, a Monday, I’m thrilled to explore the dynamic world of NASDAQ trading with the formidable Trade Scalper software. Join me on this exciting journey as I strive to achieve a $200 profit using just one contract within the next 20 minutes. But before we embark, it’s crucial to acknowledge the inherent risks involved in trading. Please ensure you only trade with funds you can afford to lose. The NASDAQ is renowned for its rapid movements, presenting both challenges and opportunities for traders. Leveraging the Trade Scalper software from Day Trade to Win, my goal is to harness these swift market shifts and hit a profit target ranging from $150 to $200. To enhance my trading approach, I’ve chosen to utilize a 5-second chart for quicker order execution, deviating from the conventional one-minute chart. Effective risk management is paramount in trading. I stress the importance of implementing robust strategies such as time-based stops and pivotal stops to mitigate potential losses. Additionally, leveraging tools like Average True Range (ATR) can offer valuable insights into market volatility, aiding traders in making informed decisions. Precision is the cornerstone of successful trading with Trade Scalper. Exact entry signals empower traders to enter positions confidently, aiming for consistent profits. While losses are an inevitable part of trading, the objective is to conclude each trading day on a positive note, whether it’s achieving gains of $50, $100, or beyond. At Day Trade to Win, our mission is to equip traders with the knowledge and tools necessary for success. Our live trading room and complimentary member accounts provide invaluable resources for traders of all levels. Through simulated trading accounts and educational materials, we strive to democratize trading and make it accessible to everyone. In conclusion, as my NASDAQ trade unfolds, adaptability and vigilance are essential. Whether you’re trading NASDAQ, E-mini S&P, or currencies, the principles of disciplined trading remain universal. Remember, trading is a journey, and continuous learning is paramount to mastering the markets. Thank you for joining me on this trading adventure, and I eagerly anticipate our next rendezvous in the world of trading!

Market News

Tech Stocks in Focus: Key Takeaways from 20 Years of Analysis

Early trading in equity futures suggests that Wall Street will likely continue last week’s strong rally. Despite recent volatility driven by concerns over rising bond yields conflicting with expectations of strong corporate earnings, particularly within the tech sector, market sentiment appears resilient. The Nasdaq 100, home to major technology companies, rebounded by about 4% last week after experiencing a slight dip of over 5% the week starting April 15th. This marked the most significant weekly gain for the broader market since early November. This resilience, often referred to as “bouncebackability,” is seen as a positive sign for the market. It indicates that investors are capable of absorbing setbacks and are eager to seize opportunities to buy when prices dip. However, short-term traders should exercise caution. Analysis by Bespoke Investment Group suggests that historical data on similar market recoveries may not bode well for this week’s trading. Looking at data since the mid-1980s, there have been 40 instances where the Nasdaq 100 saw a decline of four percent or more in one week, followed by a rise of four percent or more the next. Despite initial optimism, historical trends show that subsequent weeks have often seen the Nasdaq 100 averaging a decline of 1.38%, with recent occurrences ending in declines. This raises questions about the sustainability of market rebounds and whether they truly reflect strength or hint at underlying weakness. Significant fluctuations, such as those seen with Nvidia, may sow unease among investors. Examining the S&P 500 index, technical strategist Jonathan Krinsky of BTIG notes the challenging territory ahead, marked by the convergence of key moving averages and recent downtrends. While some analysts like Krinsky may lean towards a bearish outlook, others like Tom Lee, head of research at Fundstrat, provide a more optimistic perspective. Lee believes that the recent rally underscores the resilience of the “buy the dip” mentality, signaling further potential gains as the market moves into May. His colleague Mark Newton predicts a move towards S&P 500 5,212, potentially setting sights on 5,400 for bullish investors.

Scroll to Top