From Losses to Funding Triumph: The Power of Trade Scalper Strategies Unveiled
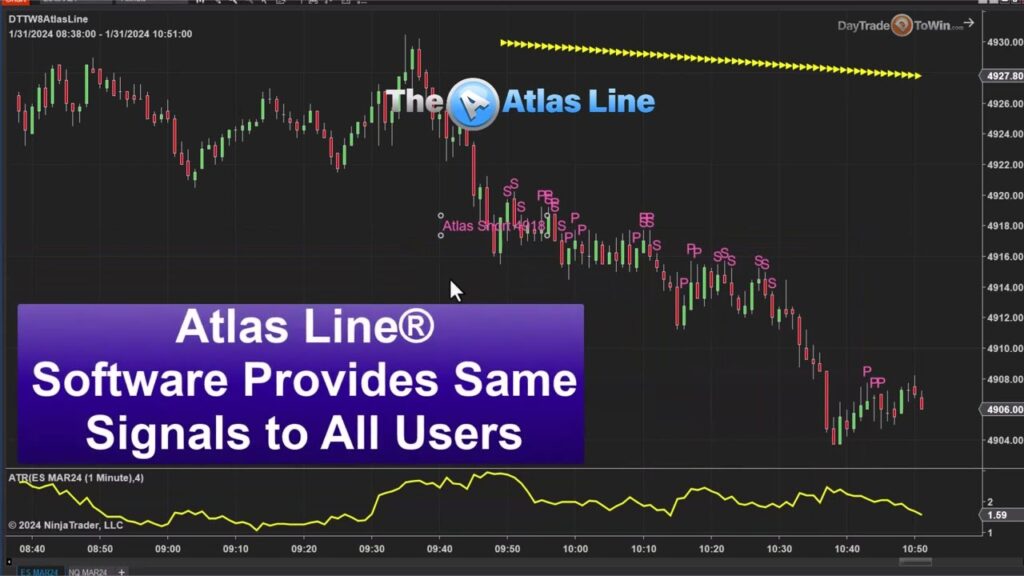
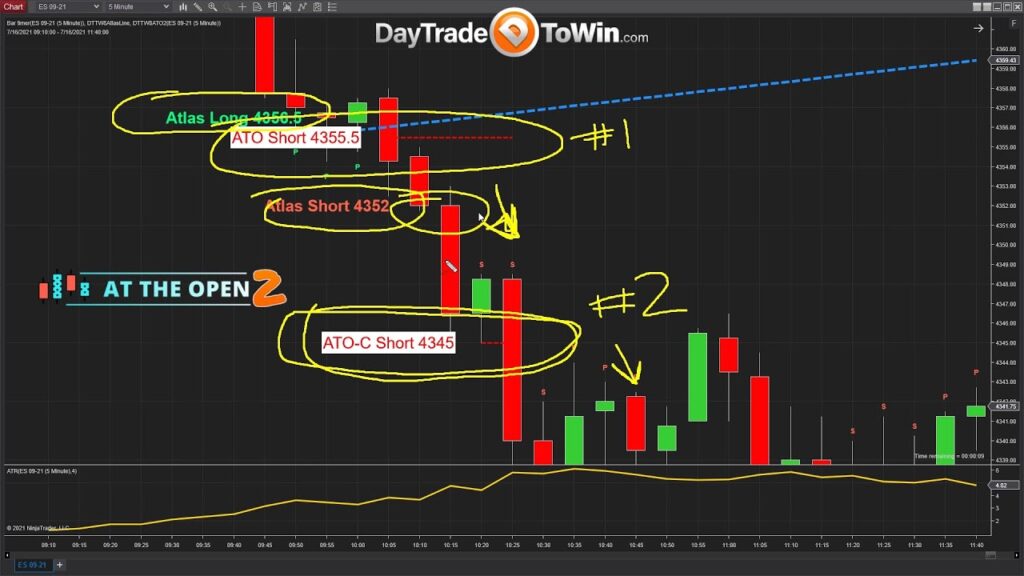
Welcome back, fellow traders! In this extensive blog post, we’ll delve into the intricate realm of day trading, placing a specific focus on the Trade Scalper method and various other strategies aimed at enhancing your trading toolkit. Unlike our previous content, this one will be a tad longer to ensure we cover all the essential aspects. So, get ready for an in-depth exploration of the Trade Scalper and insights into mastering the art of price action. Disclaimer: Before we embark on this journey, it’s imperative to acknowledge the inherent risks associated with trading. Always exercise caution, be aware of the potential risks, and refrain from investing funds you cannot afford to lose. Now, let’s plunge into the exhilarating world of day trading. To kick things off, let’s dissect the core of price action trading. We deliberately avoid subjective indicators such as moving averages and MACDs, opting for a more objective approach. The signals we hone in on are precise and unambiguous, guiding us on whether to go long or short at a given price. The primary objective is to steer clear of chasing the market and uphold objectivity in our trading decisions. At Day Trade to Win, we underscore education-based trading. It’s not about relying on a black box; instead, traders comprehend the rationale behind each signal. Understanding why a particular signal occurs is just as crucial as identifying it. This knowledge empowers traders, enabling them to make well-informed decisions. Successful traders with Apex, Leeloo, and TOP Step accounts often leverage a combination of strategies, including the Roadmap, Trade Scalper, and Atlas Line. For those intrigued by this approach, our Accelerated Mentorship program offers a comprehensive package at a discounted rate. Explore the program, encompassing the entire software suite and featuring a new live trading room as an added bonus. Now, let’s delve into the intricacies of the Trade Scalper method. Offering clear and objective signals, the Trade Scalper is an excellent choice for traders seeking funding or managing their own accounts. The key is to maintain objectivity and adhere to the established rules. In the video, we witness a short entry signal at 4919.25, showcasing a specific and objective entry point. It’s crucial to trade within a few ticks of the signal, avoiding any impulse to chase the market. Employing the Average True Range (ATR) aids in assessing market speed, while a well-defined stop is vital for risk management. The Trade Scalper‘s objective is to aim for a small target and swiftly exit the trade. Effective time management is paramount; the longer you linger in the market, the higher the risk exposure becomes. Trailing stops emerge as a viable option for larger targets, especially in volatile market conditions. The Atlas Line serves as another valuable tool in our trading arsenal, offering additional guidance by indicating the overall trend direction. Combining the Trade Scalper with the Atlas Line boosts confidence in trade decisions. As an added bonus, we’ve introduced a new live trading room for our members. It serves as an opportunity to join us daily, observe signals, pose questions, and stay actively engaged in the trading community. Conclusion: In conclusion, mastering day trading entails a fusion of education, clear signals, and effective risk management. The Trade Scalper, Atlas Line, and other strategies work harmoniously, presenting a robust approach to the dynamic world of day trading. Remember, trading success isn’t about securing every trade but rather managing risks and making informed decisions. If you have questions or wish to share your trading experiences, don’t hesitate to leave a comment below. Your engagement is highly valued. Stay tuned for more invaluable insights in our upcoming videos. Happy trading!