stock market

market
Market News

Despite Market Fluctuations, This Firm Boosts S&P 500 Target – Here’s Why

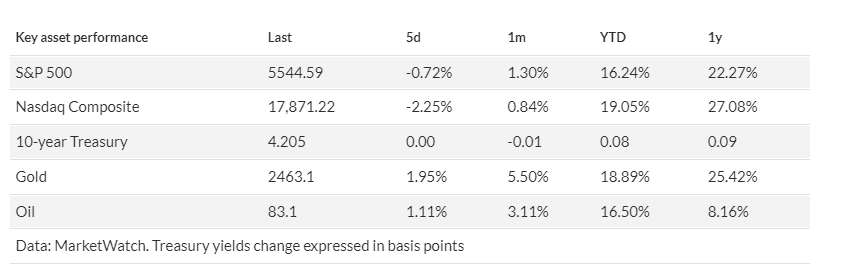
Good morning! If you’re reading this, congratulations on successfully booting up your personal computer, a feat not everyone around the globe has managed today. More on that later. Correction: Thursday’s Need to Know newsletter incorrectly reported the Nasdaq Composite’s performance. The decline on Wednesday was the sharpest since mid-December 2022. Despite recent market turbulence, the S&P 500 is only 2% away from a record high, and the Nasdaq Composite is just 4% from a new peak. Taking an optimistic stance, the UBS chief investment office has raised its S&P 500 target to 5,900 by the end of the year and 6,200 by mid-2025. Previous targets were 5,500 for December and 5,600 for June 2025. UBS cites several positive factors for U.S. equities: strong earnings growth, disinflation, the Fed’s anticipated rate cuts, and increasing investments in artificial intelligence. “While economic growth readings have cooled, we believe growth remains on solid footing. Healthy labor market dynamics should continue to support further gains in consumer spending,” said strategists led by David Lefkowitz. UBS, like many others, expects the Fed to start cutting rates in September. They note that the second-quarter earnings season has started well, though the mega-cap tech companies have yet to report. “We think trends in this segment will remain favorable with strong demand for AI infrastructure as tech companies jockey for leadership positions in the emerging AI ecosystem, and companies across the economy look to deploy AI tools into their business processes,” they say. Consequently, UBS has maintained its S&P 500 earnings per share target at $250 and raised next year’s target to $270 from $265. Addressing concerns about high valuations, UBS argues that they are reasonable given the macro environment. “Historically, when the Fed is cutting rates in the context of a soft landing, equities tend to perform well in the 12 months before and after the first Fed rate cut.” In their optimistic scenario, UBS sees the S&P 500 surging to 6,500 this year if the Fed cuts rates amid an investment and innovation boom. Their downside scenario predicts the S&P 500 could drop to 4,800 if inflation remains stubborn, higher rates weigh on growth, or geopolitical tensions escalate. Markets U.S. stock-index futures (ES00, YM00, NQ00) are inching up, with benchmark Treasury yields mixed. The dollar index is higher, oil prices (CL) have slipped, and gold (GC00) is trading around $2,417 an ounce. John PaulJohn Paul is the founder of DayTradeToWin, a trading education and software company established in 2008, supporting traders worldwide. His expertise focuses on price action-based futures trading strategies and structured market analysis. DayTradeToWin delivers trading education, indicators, and software tools designed to help traders apply disciplined, rule-based decision-making across global futures markets. He is the creator of multiple trading methodologies, including the Sonic System, Atlas Line, and Trade Scalper, which help traders identify structured opportunities in markets such as the E-mini S&P 500 (ES), Nasdaq (NQ), crude oil (CL), and gold (GC). Official website: https://daytradetowin.com daytradetowin.com

Treasury Market
Market News

Treasury Market Turbulence: Are Stocks on the Brink of a Downturn?

An inverted Treasury yield curve is typically seen as a harbinger of recession, although the U.S. economy has held up so far. An inverted Treasury yield curve is often viewed as a signal of an impending recession. But does the curve’s return to normalcy signal an all-clear for the market? History suggests otherwise. According to Tom Essaye, a former Merrill Lynch trader and founder of Sevens Report Research, the reversal of a yield-curve inversion has frequently signaled upcoming economic and stock market troubles. This potential shift is significant as the gap between short-term and long-term Treasury yields has narrowed recently. On Monday, the gap between the 2-year and 30-year yields briefly turned positive for the first time since January, according to Dow Jones Market Data. Additionally, the gap between the 2-year and 10-year yields reached its narrowest point in a similar timeframe. Analysts at Macquarie attribute these bond movements to the broader “Trump trade,” which encompasses higher tariffs, tax cuts, and restrictive immigration policies proposed by former President Donald Trump. They argue these measures could revive inflation and push up long-term bond yields. Since 1998, the spread between the 2-year and 10-year Treasury yields has inverted six times, including the current episode that began in July 2022. Previous inversions occurred in June 1998, February 2000, January 2006, June 2006, and August 2019. Only three of these instances, including the current one, saw the yield curve remain inverted for a significant period, with the others occurring in February 2000 and June 2006. In both cases, the un-inversion preceded stock market turbulence. When the 2s10s spread returned to positive territory on Dec. 29, 2000, the S&P 500 traded around 1,320 but then declined for 22 months, bottoming at around 785 in October 2002. Similarly, when the spread returned to positive on June 6, 2007, the S&P 500 was at 1,517, but the index fell over the next 21 months as the housing market collapse triggered the 2008 financial crisis, bottoming out in March 2009. It took four years for investors to recoup these losses. Essaye explains that when the 2s10s spread turns positive, it usually means the 2-year Treasury yield is dropping quickly as investors anticipate aggressive rate cuts. These cuts typically happen because the Federal Reserve is worried about economic growth. This is currently happening, with the market pricing in a 100% chance of rate cuts in September and December, and a growing likelihood of a third cut this year. Despite warnings of an imminent recession due to the Federal Reserve’s aggressive rate hikes, the U.S. economy has shown resilience. Recent data hints at slowing growth and a softening labor market, but a stronger-than-expected retail sales report on Tuesday offered some reassurance. Many stock-market experts doubt a recession is imminent, believing that Fed Chair Jerome Powell might achieve a soft landing by cutting rates later this year. Early Wednesday, Treasury yields were rising, with the 2-year up 4 basis points at 4.47% and the 10-year up 2 basis points at 4.18%. Bond yields move inversely to prices. Meanwhile, U.S. stocks opened mostly lower, with a sharp selloff in technology stocks. The S&P 500 was down 1% at 5,610, the Nasdaq Composite down 1.7% at 18,186, and the Dow Jones Industrial Average traded about 30 points, or 0.1%, higher at 40,989. John PaulJohn Paul is the founder of DayTradeToWin, a trading education and software company established in 2008, supporting traders worldwide. His expertise focuses on price action-based futures trading strategies and structured market analysis. DayTradeToWin delivers trading education, indicators, and software tools designed to help traders apply disciplined, rule-based decision-making across global futures markets. He is the creator of multiple trading methodologies, including the Sonic System, Atlas Line, and Trade Scalper, which help traders identify structured opportunities in markets such as the E-mini S&P 500 (ES), Nasdaq (NQ), crude oil (CL), and gold (GC). Official website: https://daytradetowin.com daytradetowin.com

U.S. Stocks
Market News

Calm Before the Storm? What the Calm in U.S. Stocks Means for Your Portfolio

U.S. stocks are experiencing an unusually tranquil stretch poised to hit a new milestone on Wednesday as the rally expands beyond a few megacap names. If the S&P 500 avoids a significant selloff, it will mark 352 consecutive sessions without a 2% decline, the longest streak since February 2007. ETF and technical strategist Todd Sohn from Strategas explained to MarketWatch that while many investors brace for a pullback, historical data shows that periods of market calm can last much longer than expected. Over the past 50 years, there have been four instances where the S&P 500 went even longer without a 2% drop, with the longest being a 1,044-day stretch ending in October 1979. Sohn emphasized that excessive worrying about potential threats can lead to missed opportunities. Staying on the sidelines often results in greater losses than the selloffs themselves. “In and of itself, it isn’t really something to worry about,” he said, advising investors to remain focused on their long-term investment strategies. Despite recent risks, the rally has shown remarkable resilience. Paul Hickey, an analyst at Bespoke Investment Group, noted that even significant events, like a near-assassination of a leading U.S. presidential candidate and unexpected inflation data, haven’t derailed the market’s upward trajectory. The S&P 500 continues to reach new highs, even without contributions from key stocks like Nvidia. Hickey also pointed out the low volatility, with the Cboe Volatility Index (VIX) near its lowest levels since before the COVID-19 pandemic. A low VIX indicates a solid rally but also hints at potential investor complacency, especially as stocks enter their historically weakest three-month period from mid-July to mid-October. While the S&P 500 hasn’t seen a 2% drop in a single day recently, there have been pullbacks, including a 10% correction ending in late October and a 5% drop in April. As fall approaches, the market faces risks from U.S. politics, a cooling economy, and potentially disappointing corporate earnings. Wall Street experts, including those from Citigroup and Goldman Sachs, warn that the market might be due for a selloff due to rapid gains and high valuations. However, a recent rally in lagging market segments like the Russell 2000 is sparking optimism for a rotation toward value stocks and cyclical sectors, potentially driving the next phase of the rally. The key question is whether this rotation will negatively impact the megacap stocks responsible for most of this year’s gains. Mike Dickson, head of research and product development at Horizon Investments, believes the market can continue rising even if tech stagnates, but not if it collapses. Both the S&P 500 and Dow Jones Industrial Average reached record highs on Tuesday, with the Nasdaq Composite achieving its second-highest close in history. John PaulJohn Paul is the founder of DayTradeToWin, a trading education and software company established in 2008, supporting traders worldwide. His expertise focuses on price action-based futures trading strategies and structured market analysis. DayTradeToWin delivers trading education, indicators, and software tools designed to help traders apply disciplined, rule-based decision-making across global futures markets. He is the creator of multiple trading methodologies, including the Sonic System, Atlas Line, and Trade Scalper, which help traders identify structured opportunities in markets such as the E-mini S&P 500 (ES), Nasdaq (NQ), crude oil (CL), and gold (GC). Official website: https://daytradetowin.com daytradetowin.com

bullish
Market News

Rare Bullish Signal for Small-Cap Stocks from Options Traders

The demand for bullish call options linked to the Russell 2000 has soared, significantly outpacing the demand for bearish puts. This trend sends an optimistic signal to small-cap investors. Mandy Xu, head of derivatives-market intelligence at Cboe Global Markets, reports that recent sessions have seen a notable rise in call option demand tied to the Russell 2000 and its corresponding ETF. This surge has pushed these contracts to trade at a premium over bearish puts, suggesting that the small-cap rally could continue in the near term. Xu noted a similar pattern in late 2023, when investors boosted stocks expected to benefit from aggressive Federal Reserve interest rate cuts. At that time, the Russell 2000 rallied over 20% from early November to early December, outperforming the S&P 500 and the Nasdaq Composite, according to FactSet data. “We saw this in the fourth quarter last year when bullish sentiment in small caps hit an extreme, though ultimately, the trade faded as rate-cut bets were pared back. Will it be different this time?” Xu commented in an email. Call options grant traders the right to buy shares of the underlying stock or ETF at an agreed-upon price before they expire, while put options allow traders to sell. Option contracts tied to an index are usually settled in cash. On Thursday, trading volume for calls tied to both the Russell 2000 and the iShares Russell 2000 ETF (IWM) reached their highest levels in years, as reported by Dow Jones Market Data. Nearly 2.1 million calls tied to the ETF were traded that day, marking the highest daily turnover since December 2009 and the sixth-highest on record since 2005. Call options directly linked to the index saw their highest volume since 2021. Thursday also marked the Russell 2000’s best session since November. Small-cap stocks soared following a softer-than-expected inflation reading from the June CPI report, reviving expectations of a Federal Reserve interest rate cut in September. The Russell 2000 outperformed major indices like the S&P 500 and the Nasdaq, showing its most significant outperformance since March 2020 when the COVID-19 pandemic initially impacted global markets, according to Cboe data. Over the past four sessions, the Russell 2000 has gained 7.7%, on track for its best four-day streak since 2020, according to Dow Jones Market data. The index is poised to finish at its highest level since January 2022. Demand for bullish call options has remained elevated since Thursday. Trading volume in call options tied to the iShares ETF has been more than triple the daily average from the past two years on both Friday and Monday, according to market data. The call-put volume ratio, which compares activity in bullish calls to bearish puts, has also stayed above average. On Monday, the Russell 2000 was up 2.1% at 2,194, while the S&P 500 was up 0.1% at 5,619. The Nasdaq also saw a 0.1% increase to 18,415. Meanwhile, the Dow Jones Industrial Average (DJIA) was up 157 points, or 0.4%, at 40,281. John PaulJohn Paul is the founder of DayTradeToWin, a trading education and software company established in 2008, supporting traders worldwide. His expertise focuses on price action-based futures trading strategies and structured market analysis. DayTradeToWin delivers trading education, indicators, and software tools designed to help traders apply disciplined, rule-based decision-making across global futures markets. He is the creator of multiple trading methodologies, including the Sonic System, Atlas Line, and Trade Scalper, which help traders identify structured opportunities in markets such as the E-mini S&P 500 (ES), Nasdaq (NQ), crude oil (CL), and gold (GC). Official website: https://daytradetowin.com daytradetowin.com

Small Caps
Market News

Small Caps: The Hottest Investment Now

Futures indicate a positive start for equities, with the S&P 500 nearing a record high. Despite recent calm, analysts detect a significant shift in market sentiment. Greg Boutle of BNP Paribas notes that last Thursday’s softer-than-expected consumer price index report and the resulting dip in Treasury yields triggered a major rally in overlooked market segments. Small-cap stocks gained favor, while Big Tech faced heavy selling. Though this trend partially reversed on Friday, the key question is whether small caps will maintain their upward momentum. Tom Lee of Fundstrat is optimistic. He believes small caps, tracked by the iShares Russell 2000 ETF (IWM), present the “most compelling near-term investment case,” predicting a potential 50% gain in 2024. With small caps currently up only 6%, there is significant growth potential. Lee attributes this to the low June CPI, which he believes signals continued small-cap rallies. Lee’s optimism is based on five key factors: “We see the conditions for a strong rally in IWM. Mark Newton, head of technical strategy, believes a confirming ‘breakout’ of small caps could happen this week,” concludes Lee. John PaulJohn Paul is the founder of DayTradeToWin, a trading education and software company established in 2008, supporting traders worldwide. His expertise focuses on price action-based futures trading strategies and structured market analysis. DayTradeToWin delivers trading education, indicators, and software tools designed to help traders apply disciplined, rule-based decision-making across global futures markets. He is the creator of multiple trading methodologies, including the Sonic System, Atlas Line, and Trade Scalper, which help traders identify structured opportunities in markets such as the E-mini S&P 500 (ES), Nasdaq (NQ), crude oil (CL), and gold (GC). Official website: https://daytradetowin.com daytradetowin.com

market
Market News

Small Caps Shine Amid Market Rotation

Thursday was a rough day for hedge funds heavily invested in megacap tech stocks and shorting the rest of the market. A cooler-than-expected June consumer-price index (CPI) reading ignited a rotation into previously neglected sectors. “Hedge funds are blowing up today,” said Jay Hatfield, CEO of Infrastructure Capital Advisers, referring to strategies that involve long positions in large-cap tech stocks and short bets against small- and mid-cap stocks. While this strategy had been profitable during a rally led by a select group of tech giants in 2024, the tide turned abruptly. Small-cap stocks surged, with the Russell 2000 index up 3.6%, while the Nasdaq Composite fell 2%. This marked the biggest one-day outperformance for the Russell over the Nasdaq since records began in 1986, according to Dow Jones Market Data. The key question for investors is whether this rotation is temporary or the beginning of a broader rally, following a period of concentrated market leadership. Market analysts noted sharp rises in heavily shorted stocks, indicating the squeeze could persist for some time. On Thursday, the S&P 500 pulled back 0.9% after hitting a record intraday high, while the Dow Jones Industrial Average gained 0.1%. The consumer-price index fell 0.1% in June, slowing the year-over-year rate to 3%. The core rate, excluding energy and food costs, rose 0.1%, slowing to 3.3% from 3.4%. Economists warn that more data will be needed to ensure a September rate cut by the Federal Reserve, but fed-funds futures traders now see a better than 90% probability of at least a quarter-point reduction, according to the CME FedWatch Tool. The Magnificent Seven megacap tech stocks, which had led the rally since October 2022 due to AI enthusiasm, were each down at least 2% by midday Thursday. This resulted in a market cap drop of more than $500 billion, the largest single-day loss since September 13, 2022. Despite the decline in heavyweight tech stocks dragging down the S&P 500, around 80% of the index’s stocks were higher on the day. The equal-weighted S&P 500 outperformed its market-cap-weighted version by around 1.8 percentage points, marking the biggest relative gain since January 2021. Hatfield, also the portfolio manager of the InfraCap Small Cap Income ETF, sees potential for the rally to broaden as the market anticipates continued cooling inflation readings and eventual Fed rate cuts. He expects the overall market to extend its run, having recently raised his year-end target for the S&P 500 to 6,000. A September rate cut by the Fed could continue a trend of global central banks injecting liquidity into the banking system, historically boosting both stocks and bonds. Although the S&P 500’s pullback Thursday was exacerbated by the tech selloff, Sonu Varghese, global macroeconomic strategist at Carson Group, believes it won’t be a lasting drag on the index. He anticipates that large-cap value stocks could rally and support the index’s forward momentum, even if tech consolidates. John PaulJohn Paul is the founder of DayTradeToWin, a trading education and software company established in 2008, supporting traders worldwide. His expertise focuses on price action-based futures trading strategies and structured market analysis. DayTradeToWin delivers trading education, indicators, and software tools designed to help traders apply disciplined, rule-based decision-making across global futures markets. He is the creator of multiple trading methodologies, including the Sonic System, Atlas Line, and Trade Scalper, which help traders identify structured opportunities in markets such as the E-mini S&P 500 (ES), Nasdaq (NQ), crude oil (CL), and gold (GC). Official website: https://daytradetowin.com daytradetowin.com

Scroll to Top