TradingView

blueprint
DayTradeToWin Review

Mastering Volatile Markets: A Trader’s Guide

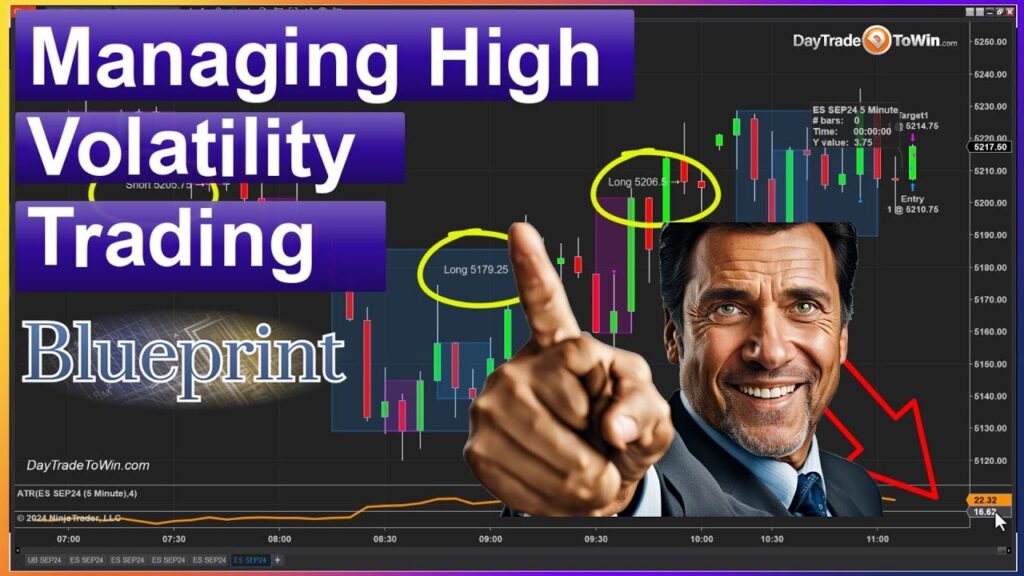
Today is an exciting day filled with market volatility. In this post, I’ll guide you through effective strategies for trading under these conditions and introduce some powerful tools that can help enhance your trading experience. Remember, trading is inherently risky, so always trade with funds you can afford to lose. Navigating Volatile Market Conditions Volatility in the market presents both opportunities and risks. It’s crucial to adapt your strategies accordingly. One tool that can be incredibly useful in such situations is the software from Day Trade to Win, available for Ninja Trader and TradingView. This software can help you secure funding through our all-access program, which includes a comprehensive suite of trading tools. The Power of The Blueprint Software The Blueprint software, part of the Day Trade to Win package, helps you make informed trading decisions by providing signals based on market movements. It identifies optimal entry and exit points, signaling you to buy or sell when the market moves outside of predefined shaded areas. A key indicator used in this software is the Average True Range (ATR). In today’s volatile market, the ATR for the E-mini S&P is about 4.2 points. Typically, we aim to keep the ATR under 5 or 6 points to manage risk effectively. Higher volatility necessitates adjustments in our trading approach. Adjusting Your Trading Strategy In a highly volatile market, adjusting the timeframe of your charts can be highly effective. Instead of using longer timeframes like 5-minute or 1-minute charts, consider switching to 20 or 30-second charts. This change helps manage risk by providing more frequent updates and allowing for quicker decision-making. For example, with an ATR of around 4 points, setting a target of 4 points on a trade aligns with current market conditions. Shorter timeframes like 20 or 30-second charts offer more manageable signals and lower risk compared to longer timeframes where each candle might represent a larger point movement, increasing the risk. Practical Example Let’s consider a practical example. On a 5-minute chart, the signals might be accurate, but each candle representing 22 points introduces substantial risk. By switching to a 30-second chart, you can still capture valuable signals but with reduced risk, making it easier to manage your trades in a volatile environment. When the market slows down, increase the timeframe of your charts to 5, 10, or 15 minutes. This adjustment helps maintain consistent profit targets while accommodating the slower market pace. Final Thoughts on Trading Strategies Adapting to market conditions is crucial for successful trading. The Blueprint software, included in our all-inclusive program, provides the tools and signals necessary to navigate volatile markets effectively. Our all-inclusive program offers a lifetime license, complete with audible alerts and comprehensive software support. If you have any questions or want to learn more, visit daytradetowin.com and sign up for a free member account. Stay informed and prepared for the next trading opportunity! Stay Connected Subscribe to our YouTube channel for daily updates and new videos that provide insights and strategies for successful trading. Don’t miss out on valuable content designed to help you navigate the ever-changing market landscape. Happy Trading! John PaulJohn Paul is the founder of DayTradeToWin, a trading education and software company established in 2008, supporting traders worldwide. His expertise focuses on price action-based futures trading strategies and structured market analysis. DayTradeToWin delivers trading education, indicators, and software tools designed to help traders apply disciplined, rule-based decision-making across global futures markets. He is the creator of multiple trading methodologies, including the Sonic System, Atlas Line, and Trade Scalper, which help traders identify structured opportunities in markets such as the E-mini S&P 500 (ES), Nasdaq (NQ), crude oil (CL), and gold (GC). Official website: https://daytradetowin.com daytradetowin.com

blueprint
DayTradeToWin Review

Profitable Trades: Using TradingView Signals with Blueprint Software

It’s Friday, 11:24 AM, and we’re diving into live market action using TradingView. Today, I’ll show you a powerful trading method with our Blueprint software, part of our all-inclusive program. This guide will explain the signals, how the method works, and give you a comprehensive understanding. Understanding the Blueprint Software When you view the E-mini S&P chart, you’ll notice the market’s fluctuations. Our Blueprint software highlights these movements with shaded areas, signaling potential support and resistance levels. These green or red shaded boxes help identify key ranges where the market might react. How It Works Live Trade Example This morning, around 10:00 AM, a shaded box formed, and we observed the market’s reaction. After three candles closed outside this box, a short signal was generated because the distance multiplier was within the acceptable range. This strategic entry ensures you’re part of the early move, maximizing profit potential. Fine-Tuning Your Entries Adjusting the distance multiplier and the number of consecutive candles required for a signal can refine your entries: Monitoring the Trade As the trade progresses, monitor the Average True Range (ATR) to set realistic profit targets. In our example, with an ATR of about three points, aiming for a two-point profit can be a prudent strategy, balancing risk and reward. Join Our Community If you have any questions or want to learn more about trading with price action, visit daytradetowin.com. Get a free member account, download free software, and immerse yourself in our comprehensive training resources. Our proprietary tools and live training room are designed to equip you with the skills needed to succeed in the markets. Conclusion Trading with price action using the Blueprint software offers a clear, objective approach to navigating market movements. By focusing on key support and resistance zones and confirming entries with consecutive candle closes, you can make informed trading decisions. Until next time, good trading! John PaulJohn Paul is the founder of DayTradeToWin, a trading education and software company established in 2008, supporting traders worldwide. His expertise focuses on price action-based futures trading strategies and structured market analysis. DayTradeToWin delivers trading education, indicators, and software tools designed to help traders apply disciplined, rule-based decision-making across global futures markets. He is the creator of multiple trading methodologies, including the Sonic System, Atlas Line, and Trade Scalper, which help traders identify structured opportunities in markets such as the E-mini S&P 500 (ES), Nasdaq (NQ), crude oil (CL), and gold (GC). Official website: https://daytradetowin.com daytradetowin.com

trading
DayTradeToWin Review

Spotting Trading Opportunities with Day Trade to Win Software

Hey traders! It’s around 1:00 PM Eastern New York time, and a promising trading opportunity has emerged. The market is heading towards the roadmap zone, a key area identified by our proprietary Day Trade to Win software, which is available for both Ninja Trader and TradingView. Before we dive into the details, remember that trading carries significant risk. Only trade with money you can afford to lose. Real-Time Alerts Our software has just triggered both an audible and a text alert at the 55.2275 mark, signaling a long position entry. Let me explain why this is significant. Understanding the Blueprint Signal The blueprint signal indicates that the market is likely moving towards the roadmap zone. This signal is vital for timing our entries, regardless of whether you’re using Ninja Trader or TradingView. Let’s expand the chart for a closer look. For trade management, you have two options: use the ATM (Automatic Trade Management) strategy or manually adjust your targets and stops. I prefer the ATM strategy, setting the target to one times the ATR (Average True Range). The number of contracts you use—be it one, two, or three—depends on your risk tolerance and preference. Some traders might opt for micro contracts to manage risk more effectively. The key to successful trading is managing the trade using the techniques we teach. Ensure there are no conflicting signals and stick to your plan. Target hit! The trade reached the target, and we’re done. It’s important not to re-enter the trade immediately. The market might present another opportunity, such as a reversal at the roadmap zone, but that requires a different strategy. Accelerated Mentorship Program Our Accelerated Mentorship Program includes all the software and courses you need to excel in trading. Visit daytradetowin.com for more information and to start your trading journey. Join Our Trading Community We offer free member account access for all traders. Join our live training room and get the videos and training you need to succeed in the markets, whether you use TradingView or Ninja Trader. Happy trading, and see you in the next session! John PaulJohn Paul is the founder of DayTradeToWin, a trading education and software company established in 2008, supporting traders worldwide. His expertise focuses on price action-based futures trading strategies and structured market analysis. DayTradeToWin delivers trading education, indicators, and software tools designed to help traders apply disciplined, rule-based decision-making across global futures markets. He is the creator of multiple trading methodologies, including the Sonic System, Atlas Line, and Trade Scalper, which help traders identify structured opportunities in markets such as the E-mini S&P 500 (ES), Nasdaq (NQ), crude oil (CL), and gold (GC). Official website: https://daytradetowin.com daytradetowin.com

roadmap
DayTradeToWin Review

Mastering Roadmap Signals for Successful Trading

Navigating the trading world requires effective tools and strategies. Today, we’ll explore roadmap signals on two popular charting platforms: TradingView and NinjaTrader. By comparing these platforms, you can decide which one suits your trading style best. Platform Overview On the left, we have TradingView charts, and on the right, NinjaTrader charts. Both platforms are favored by traders worldwide, and understanding their signals is key to making informed trading decisions. Roadmap Signals Explained TradingView Chart Roadmap Signals The principles for interpreting roadmap signals remain consistent across both platforms, as discussed in our live trading room sessions. The roadmap zone indicates potential market movements, presenting two possible scenarios: For instance, if the price bounces off the roadmap zone and reverses, we set a target using one times the Average True Range (ATR). On the TradingView chart, a purple line indicates the entry point if the price continues through the zone. This target calculation is customizable, allowing users to adjust styles, colors, and alerts. NinjaTrader Chart Roadmap Signals NinjaTrader charts operate on similar principles. The roadmap zone highlights potential reversals or trend continuations. Despite minor data feed differences, the signals on NinjaTrader closely align with those on TradingView. For example, if the market hits the roadmap zone and reverses, a signal is generated, similar to TradingView. In sideways markets, it’s advisable not to hold trades for too long. A 10-15 minute window is recommended for exit decisions in such scenarios. Comparing Signals Both platforms provide consistent signals, but entering trades closer to the roadmap zone increases accuracy. Avoid chasing trades if you miss the initial entry point; it’s better to wait for the next signal. On TradingView, when the price breaks through the roadmap zone, a yellow candle signals a potential short trade. The same logic applies to NinjaTrader, where a line shows the entry point for short trades. The ABC Indicator for TradingView For TradingView users, we offer the ABC indicator for free. Visit DayTradeToWin.com to sign up for a free member account and access the ABC indicator. We also provide comprehensive training programs, including an accelerated mentorship class that covers all our software at a discounted rate. Conclusion TradingView and NinjaTrader both offer powerful roadmap signals to help traders make informed decisions. By understanding and utilizing these signals effectively, you can improve your trading strategy. For more information, free software trials, and detailed training programs, visit DayTradeToWin.com and take your trading skills to the next level. John PaulJohn Paul is the founder of DayTradeToWin, a trading education and software company established in 2008, supporting traders worldwide. His expertise focuses on price action-based futures trading strategies and structured market analysis. DayTradeToWin delivers trading education, indicators, and software tools designed to help traders apply disciplined, rule-based decision-making across global futures markets. He is the creator of multiple trading methodologies, including the Sonic System, Atlas Line, and Trade Scalper, which help traders identify structured opportunities in markets such as the E-mini S&P 500 (ES), Nasdaq (NQ), crude oil (CL), and gold (GC). Official website: https://daytradetowin.com daytradetowin.com

roadmap
DayTradeToWin Review

Roadmap: Is This the Ultimate Indicator for TradingView?

In the world of trading, finding the right indicators to guide your decisions is crucial. Among the myriad of options available, the “Roadmap” indicator from Day Trade to Win stands out as a game-changer for many traders. This blog post will delve into why this indicator might be one of the best on TradingView. What is the Roadmap Indicator? The Roadmap indicator is designed to highlight critical price zones on your TradingView charts. These zones, known as Roadmap Zones, help traders anticipate whether the price will break through or bounce off, providing valuable signals for making trades. Risk Disclaimer: Trading involves significant risks. Only trade with funds you can afford to lose. Key Features of the Roadmap Indicator Practical Application of the Roadmap Consider a scenario where the market hits a zone but doesn’t break through. Instead, it moves sideways, indicating that the support is holding. This could be a signal to go long. Conversely, if the price breaks through the zone, it might be a signal to go short. The “Zone A Up” Feature The Roadmap also includes a feature called “Zone A Up.” If the market reaches this zone and then reverses, it indicates a potential short trade. If it breaks through, it suggests a long trade. Filtering Trades A standout feature of the Roadmap is its ability to filter out false signals, ensuring that you only act on high-probability opportunities. This filtering helps in both trend and counter-trend trading, providing entries in the direction of strong trends and opportunities for counter-trend trades when reversals occur. Tips for Using the Roadmap Conclusion The Roadmap indicator on TradingView is a powerful tool that brings clarity to trading. By identifying key price zones and offering clear signals, it helps traders make informed decisions, potentially leading to better trading outcomes. If you’re seeking an effective indicator to enhance your trading strategy, the Roadmap is worth considering. For more information and to sign up for a free member account, visit Day Trade to Win. Join their live trading room to see the Roadmap in action and learn from experienced traders. Happy trading! John PaulJohn Paul is the founder of DayTradeToWin, a trading education and software company established in 2008, supporting traders worldwide. His expertise focuses on price action-based futures trading strategies and structured market analysis. DayTradeToWin delivers trading education, indicators, and software tools designed to help traders apply disciplined, rule-based decision-making across global futures markets. He is the creator of multiple trading methodologies, including the Sonic System, Atlas Line, and Trade Scalper, which help traders identify structured opportunities in markets such as the E-mini S&P 500 (ES), Nasdaq (NQ), crude oil (CL), and gold (GC). Official website: https://daytradetowin.com daytradetowin.com

roadmap
DayTradeToWin Review

Unlocking the Power of Roadmap Trading Software

Hello Traders! It’s Friday, and like many of you, I’m eager to finish the week early. Today, I want to show you the incredible potential of the Roadmap proprietary software from Day Trade to Win in just four minutes. Before we begin, remember: trading carries risks. Never trade with money you cannot afford to lose. A Closer Look at Roadmap Trading Software On my screen, you can see the Roadmap Trading Software, available for both TradingView and NinjaTrader. Right now, there’s a strong opportunity to sell. The market is trending lower and has broken through the Roadmap zone, signaling a prime short trade. Identifying the Sell Signal Earlier, the market touched the edge of the Roadmap, hinting at a possible reversal or counter-trend trade. If you were quick, you could have gone long as the market rebounded to the Roadmap zone. However, the current situation shows the market moving lower, presenting a strong sell signal. At 10:55, the market broke the zone, indicating a short trade. How to Execute the Trade Here’s the step-by-step process: Setting Targets and Stops To set my target, I look at the ATR (Average True Range), which is 2.74. My stop loss is set similarly. I also use a time element—this trade should resolve (either hit the stop or profit target) within 10-15 minutes. I don’t want to hold this trade longer. Monitoring and Adjusting As the trade progresses, I watch for additional short signals. If another appears, I might hold the position longer. However, any long signals would prompt me to reconsider. Combining methods like the Blueprint, Atlas Line, or Trade Scalper helps us achieve the best results. Successful Trade Execution The target was hit, and I’ve marked the entry and exit points on the chart to show you this live opportunity. This isn’t a market replay—this is happening in real-time. The market breaking the zone again presents another sell opportunity. If you’re using the Roadmap, you’ll see the same potential. Wrap-Up Friday is a great day for quick trades—get in, get out, and enjoy your weekend. Today, I wrapped up by noon EST, after just two and a half hours of trading. Join us daily in the live trading room to master price action trading. Don’t miss out on these opportunities. Visit Day Trade to Win to learn more about our software, available for NinjaTrader and TradingView. Happy trading, and enjoy your weekend! Maximize your trading success with the Roadmap Trading Software and revolutionize your approach to the markets. Join our community and trade with confidence! John PaulJohn Paul is the founder of DayTradeToWin, a trading education and software company established in 2008, supporting traders worldwide. His expertise focuses on price action-based futures trading strategies and structured market analysis. DayTradeToWin delivers trading education, indicators, and software tools designed to help traders apply disciplined, rule-based decision-making across global futures markets. He is the creator of multiple trading methodologies, including the Sonic System, Atlas Line, and Trade Scalper, which help traders identify structured opportunities in markets such as the E-mini S&P 500 (ES), Nasdaq (NQ), crude oil (CL), and gold (GC). Official website: https://daytradetowin.com daytradetowin.com

Scroll to Top