Mastering the Art of Trading Confluence: Where Strategies Align for Success!
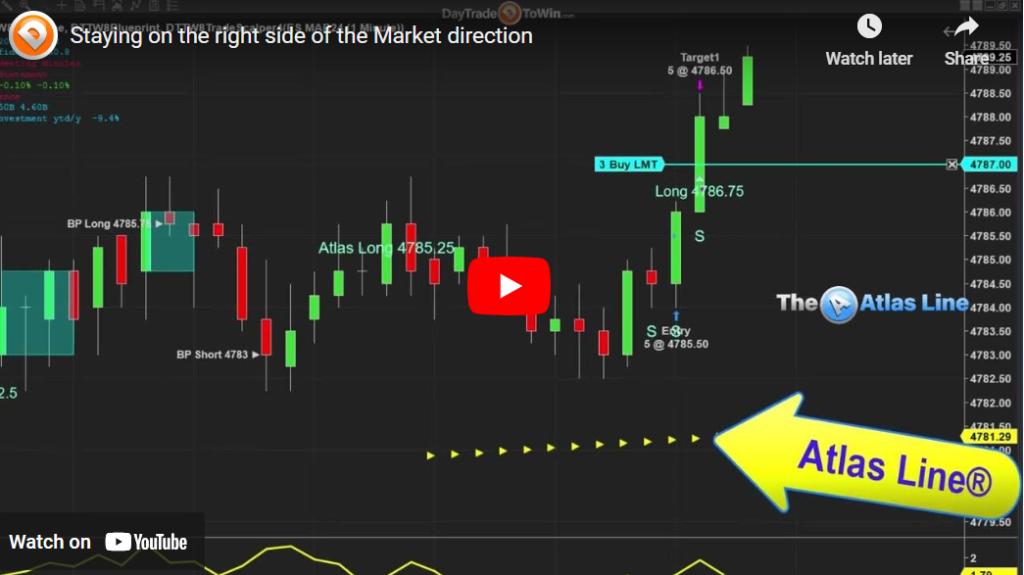
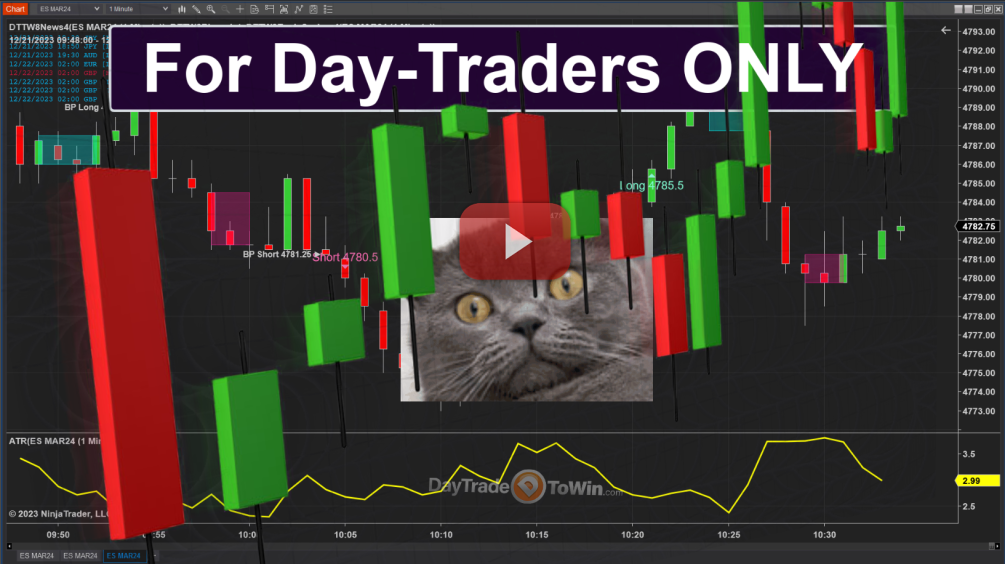
Greetings Traders! ? As we gear up for the year-end celebrations, let’s take a moment to delve into our trading strategies and explore the potent combination of Trade Scalper and Blueprint. Whether you’re a seasoned pro or just venturing into the dynamic realm of financial markets, this blog post is your guide to decoding signals, seizing opportunities, and mastering the art of patience. Unlocking The Winning Blueprint Envision having a blueprint that effortlessly charts potential trade opportunities. That’s precisely what the exclusive DayTradetoWin Blueprint accomplishes. In a recent chart, long trade signals took center stage, culminating in a compelling Blueprint long signal at 47.8150. The allure of a swift target, around two points, added an exciting dimension to this venture. Yet, the crucial lesson lies in exercising patience. Trading unfolds linearly, and seasoned traders recognize the value of restraint. The post-trade shaded area signifies a fresh opportunity, hinting at an upcoming market move—be it an ascent or descent. This is where the Blueprint shines brightest, guiding you toward novel prospects. Revelations of Trade Scalper Introducing the Trade Scalper – your ultimate companion for pinpoint short opportunities. In the face of a descending market trend, the Blueprint short signal at 47.827 emerges as a prime entry point for those armed with the Blueprint strategy. For astute traders who prefer aligning multiple signals, the Trade Scalper steps in with another short trade. This convergence of signals signals a potential market downturn, presenting a golden opportunity for those eyeing short positions. Harmony in Strategy Intersection As the market narrative unfolds, the merging signals of Blueprint and Trade Scalper paint a vivid tableau. The synchronization of these strategies signifies an opportune moment to opt for short positions, spotlighting the prowess of amalgamating diverse tools for a holistic trading approach. In Closing: Revel in Triumph and Stay Informed With the holiday season around the corner, take a moment to celebrate successful trades and anticipate the market’s next moves. Remember, trading carries inherent risks, so tread cautiously. Subscribe to the DayTradetoWin YouTube channel for live streams, giveaways, and promotions. Explore the free member account at daytradetowin.com for invaluable resources, including indicators and tools. Here’s to wishing you joyous holidays and a path paved with trading success ahead! ?