S&P 500
Market News

Rare S&P 500 Signal — Is a Big Move Coming?

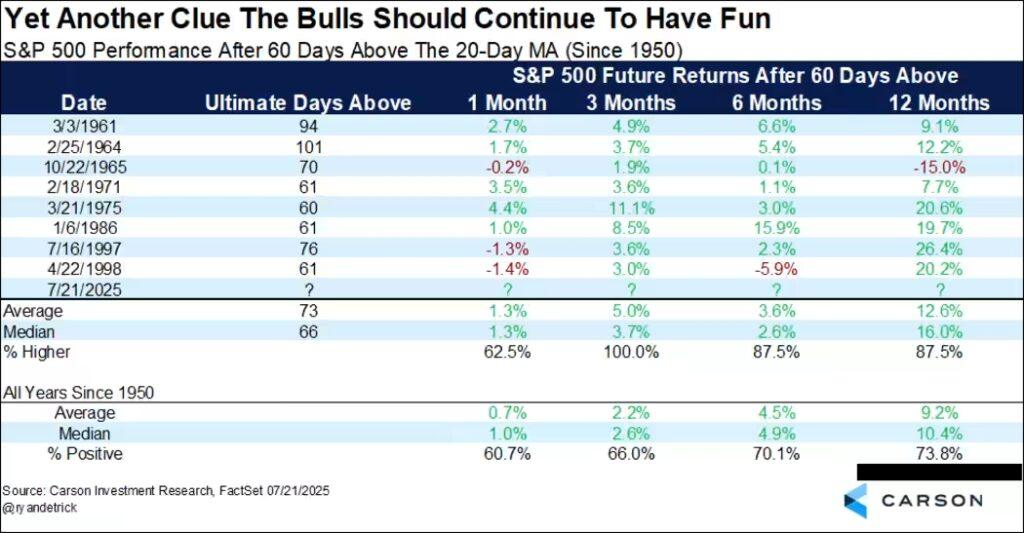
A key U.S. stock index has remained above its 20-day moving average, underscoring the market’s resilience. Japan is also in focus Wednesday after reaching a tentative trade agreement with the U.S., while speculation swirls over whether its prime minister will soon depart. The tariff news has fueled optimism heading into the Aug. 1 deadline — a date even President Donald Trump and Treasury Secretary Scott Bessent suggest is flexible. Carson Group’s chief market strategist, Ryan Detrick, points out a striking milestone: The S&P 500 (SPX) has now closed above its 20-day moving average for 60 straight sessions. Aside from a brief scare on June 20, the streak has remained unbroken. Historically, runs this long have occurred only four times since 1950, with average gains of 20% to 26% in the year that followed. Detrick’s analysis shows eight similar streaks overall, but this marks the first instance in the 21st century. While one exception in 1965 saw the market decline a year later, the typical outcome was a median gain of 10.4% and an average gain of 9.2%. “This is yet another clue this bull market still has legs,” Detrick said. Some analysts caution, however, that such strength could also signal overheating — a pattern recently noted in the Nasdaq-100 as well.

roadmap
DayTradeToWin Review

Spot Reversals Early with Roadmap Zones

If you’re tired of getting caught off guard by sudden reversals or fake breakouts, it’s time to start trading smarter—with Roadmap Zones. This unique software helps you pinpoint key areas of market manipulation—zones where price is likely to reverse, stall, or surge. Available now for TradingView and NinjaTrader, you can try it out free and see the power of precision trading. What Makes the Roadmap Different? The Roadmap isn’t your typical indicator. It’s a price-action based tool that highlights high-probability reversal zones on your chart—shown as blue and red shaded areas. These zones help you answer two critical questions: 🔹 Will the market hold this level?🔹 Is this trend likely to continue or reverse? When price enters a zone and fails to push through, the Roadmap alerts you to a possible reversal. If it breaks cleanly through the zone, that’s your cue that momentum is likely continuing. Real-World Example: Trading the E-mini S&P 500 Here’s what just happened on the E-mini S&P chart using Roadmap Zones: 📍 The market dropped into a blue zone right at the open—Roadmap flagged a long entry. The price reversed cleanly, confirming the signal. 📍 Later, price hit a red zone, stalled, and printed a short signal. It went sideways for about 30 minutes, then reversed again—classic Roadmap behavior. 📍 Another move lower? Price entered a zone, stopped, printed a long signal, and turned back up—helping traders avoid shorting into a reversal. These are the kinds of setups traders dream about—clear, rule-based signals rooted in real-time market behavior, not lagging indicators. Why You Need This in Your Toolkit ✅ Filter bad trades and stay out of traps✅ Spot reversals early using real-time price action✅ Avoid chasing trends that are about to fail✅ Use it on your favorite platform—NinjaTrader or TradingView And yes—it works live, in real-time, not just in hindsight. Try Roadmap FREE – No Risk, Just Results We’re offering a free trial at DayTradeToWin.com. You’ll also get access to live training, support, and even other tools like the ABC software. If you’re ready to level up your trading, check out our Accelerated Mentorship Program. You’ll unlock every proprietary strategy and get step-by-step guidance from experienced traders. Ready to Trade with an Edge? 📌 Visit DayTradeToWin.com🎁 Create your free member account📈 Start using Roadmap Zones to time your trades with confidence Stop guessing. Start trading smarter. Join our community of serious traders today.

stocks
Market News

Warning: Stocks Losing Support?

What Will Drive Stocks Higher Now? Strategist Sees Bullish Fatigue Setting In Since 2012, the S&P 500 has been on a mostly steady climb—an easy reason for investors to keep holding on. But recently, it’s not just that stocks are rising; it’s that sellers have all but vanished. And that, says Andrew Thrasher of Thrasher Analytics, could be a red flag. In his latest research, Thrasher found that downside activity in the market has hit unusually low levels. “We’re not seeing much volume in declining stocks,” he told MarketWatch. “There’s no real capitulation or heavy selling happening—just relentless buying. That’s often a sign of overly bullish sentiment.” His data shows that in early July, just 39% of trading volume came from declining stocks—well below the 42% threshold that has historically signaled a near-term pullback. Similar setups preceded drops in 2020, 2019, and 2016. Now, that ratio has nudged higher to 44%, a sign that sellers may finally be stepping back in. “We’re starting to see more downside volume, fewer new highs, and generally weaker participation from individual stocks,” Thrasher said. “It’s not falling apart—but it’s thinning out.” Thrasher, who helps manage over $800 million at The Financial Enhancement Group, says the market still looks “structurally sound,” but he questions what catalyst could drive the next big move up. Lingering tariff risks and the potential for rising inflation could pressure consumers and shift market sentiment. While he continues to focus on price action first and foremost, Thrasher warns that overly one-sided bullishness can’t last forever. “At extremes, the market becomes like a teeter-totter—too many people on one side, and it can’t move.”

sonic
DayTradeToWin Review

Scalp or Swing? Sonic Does Both

Today’s a quick breakdown of how the Sonic Trading System is working on the NASDAQ, especially if you’re trading the E-mini NASDAQ on platforms like NinjaTrader or TradingView. Let’s dive in — but first, a quick reminder: trading is risky. Only use capital you can afford to lose. 🎯 What the Sonic System Does The Sonic system gives you: By default, targets are set to 2x the ATR (Average True Range), meaning they scale with the current market volatility. This gives you smarter, real-time trade setups based on actual price movement. 💰 Scalp Fast or Hold for More? Option 1: Quick Scalps (2x ATR) Want in and out trades? With a 2x ATR setting, you can rack up: You don’t need to take 20 trades. Just 4-5 solid wins could bring in $500–$1,000. At that point? Shut it down and enjoy your day. Option 2: Bigger Targets (5x ATR) Prefer fewer trades with higher gains? Adjust the system to 5x ATR. This opens up larger moves: Two or three of these? That’s $1,000–$2,000 — no overtrading required. ⚙️ Why Sonic Works Whether you’re scalping or riding trends, Sonic fits your style. 🧭 Get Started for Free We’re offering free trials of our tools, including: Just sign up for a free member account at DayTradeToWin.com. Everything works on NinjaTrader or TradingView. 🚀 Join the Program Want access to it all? Enroll in our Accelerated Mentorship Program and get: 💡 Final Word Success in trading isn’t about how often you trade — it’s about being consistent, disciplined, and done early.Let the Sonic System help guide your trades. Less stress. More clarity. 👉 Start your free trial todayYour next winning trade might be closer than you think.

stocks
Market News

Too Hot? JPMorgan Warns on Crowded Volatile Stocks

The High-Beta Frenzy: A Warning Sign for Markets As U.S. stocks hover near record highs, enthusiasm for high-volatility names is boiling over — and that’s making some analysts nervous. CNBC’s Jim Cramer just unveiled his latest acronym: PARC — Palantir, Applovin, Robinhood, and Coinbase — a group of high-beta, momentum-driven stocks. Critics were quick to point out that “PARC” spelled backward is a warning in itself. More importantly, this surge into high-beta stocks is setting off alarms on Wall Street. JPMorgan strategist Dubravko Lakos-Bujas says investor positioning has hit extreme levels. In fact, he notes this is the third major “crowding” event this year: According to JPMorgan, the current high-beta crowding is in the 100th percentile — meaning it’s as extreme as it gets — and the speed of the move is unprecedented, rising from the 25th to 100th percentile in just three months, the fastest in 30 years. Short interest has also collapsed, indicating that investors aren’t hedging for downside risk. “This level of positioning reflects complacency and presents a risk not just to these speculative stocks but to the broader market,” Lakos-Bujas warned. Many of the most crowded names are retail favorites, including: So, what now? JPMorgan suggests rotating into low-volatility stocks, which underperformed after peaking in April but now offer compelling risk/reward. With upcoming tariff deadlines (Aug. 1), seasonal market weakness, and stretched investor sentiment, defensive names could shine. Their top picks include: In a market chasing risky bets, the safer plays may soon have their moment again.

market
Market News

What This Fund Manager Learned from Market Swings

Akre Capital’s John Neff Builds Cash Pile, Stays Focused on Quality Amid Uncertainty John Neff, CEO and CIO of Akre Capital Management, is preparing for potential market dislocations by raising the firm’s cash position from 1.4% to 8.1% this year. In his Q2 shareholder letter, Neff said the move isn’t driven by any immediate catalyst, but rather a desire to stay ready. “We’ve made a point of raising our cash position in case our valuation discipline and patience gets rewarded in the weeks and months ahead,” he explained. Neff leaned on historical research to frame his long-term approach. He referenced the 2021 study, Even God Would Get Fired as an Active Investor, which showed that even if an investor could perfectly predict the best-performing stocks over five years, they would still face major drawdowns — up to 76% during the Great Depression and roughly 40% in more recent crises. He also pointed to research from Morgan Stanley’s Michael Mauboussin and Dan Callahan. They found that even the most successful companies — Apple, Microsoft, Nvidia, Alphabet, Amazon, and Exxon Mobil — experienced average peak-to-trough losses of 80%. And the median stock never fully recovered. However, the highest-quality businesses nearly doubled in value five years after bottoming. Neff believes that insight supports Akre’s focus on business quality and compounding, which he says differs meaningfully from traditional value investing. “Those distinctions center on the primacy of business quality,” he noted. During the March 2020 COVID selloff, Akre invested $1.1 billion but avoided sectors like airlines and cruise lines, which he did not consider durable businesses. While the airline sector (via the JETS ETF) initially rebounded 86%, its long-term performance faded. In contrast, Akre’s 2020 investments gained 75% in the first year and have since compounded at 22% annually, excluding dividends. Today, Akre’s top holdings include Constellation Software, Mastercard, Visa, Brookfield, KKR, and Moody’s. On potential threats to Visa and Mastercard from stablecoins, Neff said he sees them more as new currencies to integrate into existing payment networks than as competitors. In the face of a richly valued market, Neff’s message is clear: stay focused on quality, be patient, and keep cash ready for when the odds improve.

Scroll to Top