vix
Market News

Market Panic Eased — Time to Act?

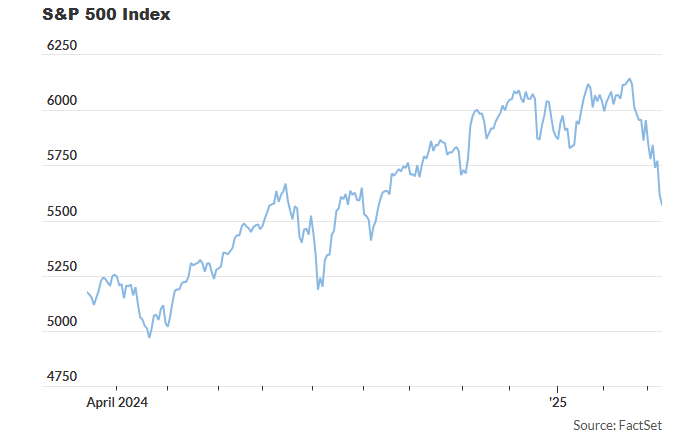
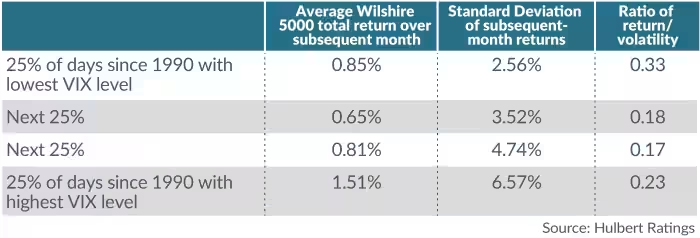
A VIX Spike Can Be Bullish — But Volatility Comes With a Price A surge in the VIX often signals heightened fear — and for contrarians, that can mean opportunity. But while a spiking, it can sometimes precede gains, it also brings sharp market swings that can shake even experienced investors out of their positions. Right now, the VIX is elevated, and if it remains at current levels through the end of March, a cautious portfolio adjustment would suggest reducing equity exposure for April to around 47.6%. The VIX — often called Wall Street’s “fear gauge” — has more than doubled in just 16 trading sessions from mid-February through last week. At current readings, it’s sitting above 92% of all daily levels since 1990. Contrarians see this as a bullish signal, particularly when the spike is sudden and sharp. But here’s the reality: Stocks historically perform better when volatility is low. While high VIX levels may precede market rebounds, those rebounds are often extremely volatile. In contrast, periods of low volatility tend to produce steadier, more reliable returns. A Smarter Way to Manage Risk Research from finance professors Alan Moreira (University of Rochester) and Tyler Muir (UCLA) supports a volatility-based strategy. Their work, “Volatility-Managed Portfolios,” shows that adjusting equity exposure based on volatility levels can improve risk-adjusted returns over time. Their approach is simple: For example, let’s say your target equity exposure is 60%, and you use the VIX’s historical median of 17.61 as your baseline. With a VIX reading of 19.63 at the end of February, you’d scale back equity exposure to 53.8%. If the VIX remains elevated, the model suggests dialing back to 47.6% for April. Since 1990, this strategy has consistently outperformed buy-and-hold on a risk-adjusted basis, with a Sharpe ratio of 0.99 compared to the market’s 0.78 — and it’s continued to outperform in real-time since the study’s publication. The Contrarian Mistake Contrarians aren’t wrong that markets can rise after periods of high volatility. But they often overlook the risk: the return-to-volatility ratio is less favorable when the VIX is high. Historical data shows that although average monthly returns after the highest VIX readings are nearly double those after the lowest VIX readings, the accompanying volatility is nearly three times greater. What This Means Now With the VIX currently in its highest quartile historically, the next market move could very well be upward — but expect a turbulent ride. For most investors, adjusting exposure based on volatility, rather than betting on fear turning into sudden gains, may offer a smoother path to solid returns.

market
Market News

No Fed Rescue for Trump’s Market Bulls

Don’t Count on a ‘Powell Put’ This Week, Economist Warns Investors hoping for Federal Reserve intervention amid market volatility may be out of luck. Fed Chair Jerome Powell is unlikely to signal any support measures when policymakers meet this week, despite recent stock market weakness. “The upside risks to inflation suggest that, despite the recent downturn in equities, the chances of a ‘Powell put’ are slim,” said Stephen Brown, deputy chief U.S. economist at Capital Economics. A “Powell put” refers to the expectation that the Fed will step in with rate cuts or other measures if markets decline sharply—a notion dating back to the 1987 stock crash, when then-Fed Chair Alan Greenspan swiftly lowered interest rates. But Powell has consistently signaled a cautious, data-driven approach, making a policy pivot unlikely in the near term. Investors received a similar message last week from former President Donald Trump, who dismissed concerns that his aggressive tariff policies could hurt the economy. In a television interview, he suggested that any short-term pain would be outweighed by long-term trade benefits, effectively ruling out a “Trump put.” That stance forced markets to reassess the likelihood of policy relief from the White House. As a result, stocks have struggled under persistent uncertainty. The S&P 500 posted its fourth consecutive weekly loss, with the Nasdaq Composite slipping into correction territory. The Dow Jones Industrial Average and the small-cap Russell 2000 also approached key technical levels before rebounding on Friday—coincidentally, a day when Trump remained silent on trade matters. More than immediate economic damage, investors fear that prolonged uncertainty around tariffs and policy direction could stifle business investment, hiring, and growth, setting the stage for a slowdown. “The unpredictability of policymaking is more damaging than the tariffs themselves,” said Kevin Gordon, senior investment strategist at Charles Schwab. “Companies can adapt to tariffs if they know what to expect. The real problem is constantly changing policies.” That uncertainty is reflected in consumer sentiment. The University of Michigan’s consumer confidence index fell to a 29-month low in March, highlighting growing economic anxiety. Meanwhile, markets have priced in three potential rate cuts for 2025, anticipating weaker growth ahead. But the Fed faces the same unpredictability as investors. The central bank’s dual mandate—balancing inflation control with full employment—complicates its decision-making. A mix of rising inflation and policy-driven job losses makes it difficult for Powell to justify rate cuts. Given this backdrop, Powell is expected to stick to his patient, wait-and-see approach. Earlier this month, he emphasized that sentiment readings don’t always translate to real economic shifts, reinforcing the Fed’s cautious stance. For investors, that means prioritizing quality. Stocks of companies with strong balance sheets, steady earnings growth, and low volatility have been among the most resilient during recent market turmoil. In uncertain times, financial stability remains key.

S&P 500
Market News

S&P 500 Slumps – Here’s What to Expect

The S&P 500 officially closed in correction territory on Thursday, marking its fastest peak-to-correction decline since March 2020. Another day, another tariff-driven selloff on Wall Street. The U.S. stock market’s sharp decline continued on Thursday, with the S&P 500 dropping 1.4% to close at 5,521.52. The index has now entered correction territory—defined as a 10% drop from its recent high—after falling more than 10% from its February 19 peak of 6,144.15. This correction took just 16 trading days, making it the swiftest such decline since the six-day plunge at the onset of the COVID-19 pandemic in March 2020, according to Dow Jones Market Data. Market Performance After a Correction Historical data suggests that stocks often struggle in the short term after entering correction territory but tend to recover over time. Since 2008, the S&P 500 has averaged a 1.7% decline in the first month following a correction. However, over the next three and six months, the index has historically rebounded by 2.1% and nearly 5%, respectively. One year after a correction, the S&P 500 has posted an average gain of 15.3%, according to Dow Jones Market Data. Tariffs and Market Volatility Thursday’s selloff was exacerbated by escalating trade tensions. President Donald Trump intensified tariff threats against the European Union, calling it a “hostile and abusive taxing and tariffing authority” and warning of a 200% tariff on EU alcohol imports. Meanwhile, Canada is embroiled in a tit-for-tat tariff dispute with the U.S., with Canadian Finance Minister Dominic LeBlanc and Ontario Premier Doug Ford meeting with U.S. Commerce Secretary Howard Lutnick to address trade tensions. The dispute stems from recent U.S. tariffs on steel and aluminum, along with previous threats of a 25% tariff on all Canadian goods. The uncertainty surrounding Trump’s trade policies and retaliatory measures from global partners has fueled risk-off sentiment, increasing volatility and raising concerns about an economic slowdown. Understanding Market Drawdowns Despite the recent downturn, market experts suggest that such pullbacks are not unusual. Adam Turnquist, chief technical strategist at LPL Financial, noted that since 1950, 92% of trading days have experienced some level of drawdown from the S&P 500’s peaks. Declines of less than 5% occur in about 40% of cases, while pullbacks between 5% and 15% have taken place in over a quarter of all trading days. “Although this correction is sharp, it’s not out of the ordinary,” Turnquist explained. He pointed out that rapid selloffs often create oversold conditions, but ongoing market weakness, lack of institutional participation, and defensive sector rotations suggest caution when considering buying the dip. Market Close and Outlook On Thursday, U.S. stocks ended lower, with the Nasdaq Composite falling nearly 2% and the Dow Jones Industrial Average dropping over 530 points, or 1.3%, according to FactSet data. As investors navigate ongoing trade uncertainties, the focus remains on whether the market can stabilize in the coming weeks.

S&P 500
Market News

S&P 500 Rapid Correction: A Turning Point?

The S&P 500 recent slide into correction territory occurred at the fifth-fastest pace since 1950, according to Fundstrat’s Tom Lee. Historically, such swift declines have been followed by a rebound within three months. The speed of this selloff has taken investors by surprise. Just a few months ago, markets were riding a wave of strong returns. Now, concerns over President Trump’s aggressive policy moves—mass federal layoffs and escalating trade tensions—are fueling recession fears. Major investment banks, including Goldman Sachs and J.P. Morgan, have raised the likelihood of an economic downturn before year-end. Despite the volatility, Lee sees opportunity. His latest report, shared with MarketWatch, suggests corrections often serve as attractive entry points for bold investors. A Look at Market History The two fastest corrections in recent history occurred during the COVID-19 crash (February 2020) and the “volmageddon” selloff (January 2018), taking just eight and 13 days, respectively, for the S&P 500 to drop 10%. Outside of the COVID-19 crash, stocks typically began recovering within a month. Lee’s data shows that in six similar corrections, the S&P 500 gained a median of 9% in three months, 15% in six months, and 21% within a year. While the sample size is small, the trend suggests that sharp declines often lead to swift recoveries—unless accompanied by a recession. Recession Concerns vs. Market Signals Lee remains skeptical of the growing recession fears. He points out that corporate bond markets remain stable, and global equities—particularly in Europe and China—continue to perform well despite U.S. trade tensions. Additionally, the Federal Reserve’s willingness to intervene, reflected in falling Treasury yields, suggests a potential safety net for investors. Lee also argues that the current 10% market pullback is pricing in a roughly 40% chance of a recession—far from a certainty. Historically, stock declines during recessions have averaged 24%, meaning this downturn could remain a correction rather than a full-blown bear market. What’s Next for Investors? Goldman Sachs strategists highlight that since 1980, there have been 21 market corrections of 10% or more. The key differentiator in recovery has been whether a recession followed. During non-recessionary periods, stocks rebounded significantly. For now, Goldman recommends shifting toward defensive stocks less dependent on economic growth, along with trending themes like artificial intelligence. Market volatility persisted on Wednesday, though the S&P 500 climbed 0.5%, paring some losses from its February peak. The Dow Jones remained in negative territory, while the Nasdaq Composite surged over 1%, led by a strong performance from semiconductor stocks like Nvidia, which jumped 6.4%.

sonic
Market News

Sonic System & Trade Scalper: The Perfect Pair

Today, we’re diving into the market using the Sonic Trading System and the Trade Scalper to analyze trading opportunities. Trading carries risk, so always trade responsibly and never risk funds you cannot afford to lose. Market Overview & Trading Strategy The Sonic Trading System has identified a short trade opportunity at 55.9375, aligning with the market’s bearish trend. While conditions may change later in the day, selling pressure remains dominant for now. To enhance our strategy, we’re also using the Market News Indicator, which provides real-time alerts for upcoming economic events that could impact price action. If you don’t have the News Indicator, you can download it for free at daytradetowin.com by signing up for a free member account. This tool is particularly useful for NinjaTrader users, helping traders stay informed of key market-moving events. Trade Execution & Risk Management Both the Sonic Trading System and the Trade Scalper are currently signaling short trades. If you purchase the Sonic System, you’ll receive the Trade Scalper as a bonus! I’ve taken a short trade based on a Trade Scalper signal, entering with one contract. Before placing any trade, always check market volatility. Too much or too little movement can impact your trade. We use the ATR (Average True Range) to measure market speed and adjust targets accordingly. For beginners, I recommend trading micro contracts instead of standard E-mini contracts: This allows for lower risk while learning the strategies effectively. Short Trade Strategy & Execution Since the market is trending downward, we are focusing on short positions. Here’s how I optimize my trades: In today’s session, my target was 55.83, with an entry at 55.8750. Market conditions dictate target size—smaller targets in slow markets, larger targets in fast markets. Live Trading Recap To confirm this is a live trading session, I’ve included an online clock on the screen. While some portions of the video are sped up for efficiency, all trades are executed in real time. Trade Recap: On my previous trade, I secured 5 points ($250 per contract). A realistic daily goal for traders using one contract is around $400-$500, achievable within 30-60 minutes if you follow the rules. The Realities of Trading Let’s be clear—trading is not easy. It’s emotional, requires discipline, and involves real risk. Here’s my advice: Final Thoughts With three to four successful trades today, I’m done for the session—no need to overtrade. If you have questions or want to learn more, visit daytradetowin.com and check out yesterday’s video on forecasting for 2025. 🔹 Sign up for a free member account to access: ✅ Free trial software ✅ The ABC System ✅ Exclusive price-action strategies ✅ The proprietary Sonic Trading System Join our accelerated mentorship program and start trading the right way! Let’s get you set up in the next training session. Happy Trading & See You in the Markets! 🚀

S&P 500
Market News

S&P 500 Drops Amid Trade Jitters

On Tuesday, the S&P 500 closed 0.8% lower, settling at 5,572.07, after a volatile trading session, according to FactSet. A correction would occur if the index falls 10% from its recent peak, which would bring it to 5,529.74, based on Dow Jones Market Data. Morgan Stanley’s Andrew Slimmon, senior portfolio manager for U.S. equities, stated, “I don’t believe the administration’s aim is to push the economy into a recession,” regarding President Donald Trump’s tariffs. The U.S. stock market is facing a downturn, fueled by negative sentiment surrounding Trump’s tariffs. The S&P 500 is struggling to recover from a significant drop, nearing correction territory. Slimmon expressed in a phone interview that market participants are focusing on the “darker side of tariffs.” He remained unconvinced that these tariffs would cause major inflation or severely harm the economy. As tariffs—both imposed and threatened by the White House—continue to loom, market volatility has been increasing. Investors are concerned that the tariffs could escalate trade wars, hurting the economy and driving inflation. President Trump announced on Tuesday that a new 25% tariff would be imposed on all steel and aluminum imports from Canada, raising the total tariff to 50%. This move was linked to Ontario’s proposed 25% tariff on electricity exports to the U.S., effective Wednesday. However, following a retreat from Ontario Premier Doug Ford on the electricity surcharge, the U.S. administration backtracked and decided to maintain the original 25% tariff on metals. As the market processes this shifting news, Slimmon acknowledged that there’s substantial uncertainty. However, he asserted, “I don’t think the administration is trying to drive the economy into recession.” Meanwhile, the market is bracing for reciprocal tariffs that President Trump plans to implement on April 2. Slimmon noted that U.S. stocks may struggle to rally significantly ahead of that date, as investor sentiment has turned increasingly negative over tariff concerns. Despite the broader selloff, Slimmon sees potential buying opportunities. He emphasized that when the market reacts negatively to Washington, investors should focus on fundamentals. He expects the market to be higher by the end of the year, though he wouldn’t be surprised by a single-digit return. After strong years in 2023 and 2024, U.S. stocks are stumbling in 2025, with the S&P 500 down 5.3% as of Tuesday. Tom Essaye, founder of Sevens Report, commented that the market is now in a “fair value” range and could see some buying interest if fears of a policy-induced growth slowdown don’t materialize. The Cboe Volatility Index (VIX), a gauge of investor anxiety, has jumped nearly 55% this year, reaching almost 27 on Tuesday. Slimmon pointed out that speculative stocks have been especially hard-hit in the downturn, with momentum stocks taking a heavy beating. However, he sees potential in well-established Wall Street banks and certain Big Tech companies, particularly semiconductor stocks, which are more appealing than a few weeks ago. While many Big Tech stocks have struggled this year, including Nvidia Corp., down 19%, and the iShares Semiconductor ETF, down nearly 11%, Slimmon believes they may present good opportunities moving forward. Despite concerns over slowing growth, market participants are pricing in potential interest rate cuts by the Federal Reserve by year’s end. However, Slimmon does not expect a U.S. recession this year and sees the Fed as a potential counterbalance to investor concerns about fiscal policies. Still, Monday’s sharp selloff, with the S&P 500 dropping 2.7%, has unsettled investors. Nicholas Colas of DataTrek Research remarked that the drop isn’t a clear sell signal but suggests caution amid market volatility.

Scroll to Top