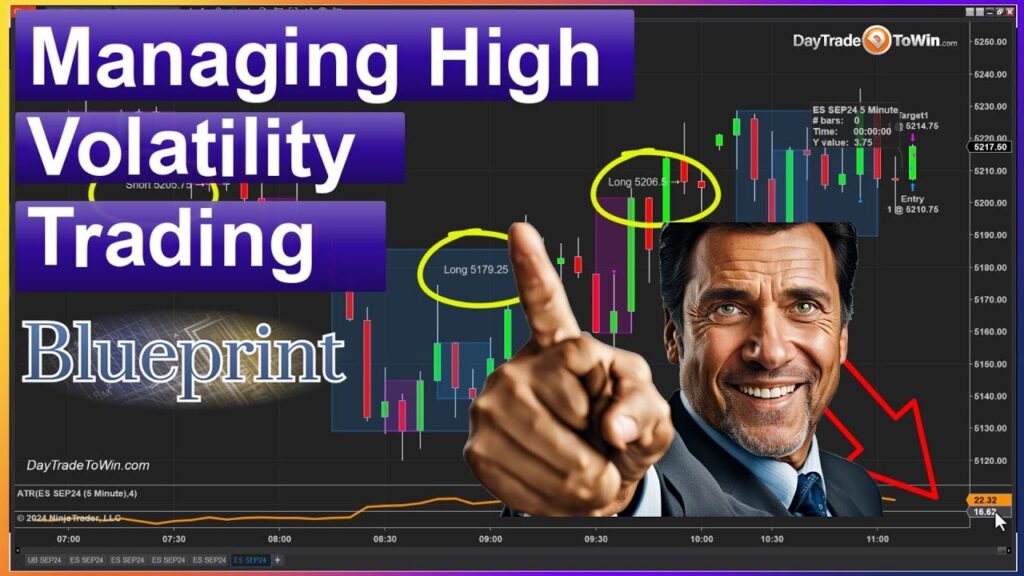
Mastering Market At The Open Strategies
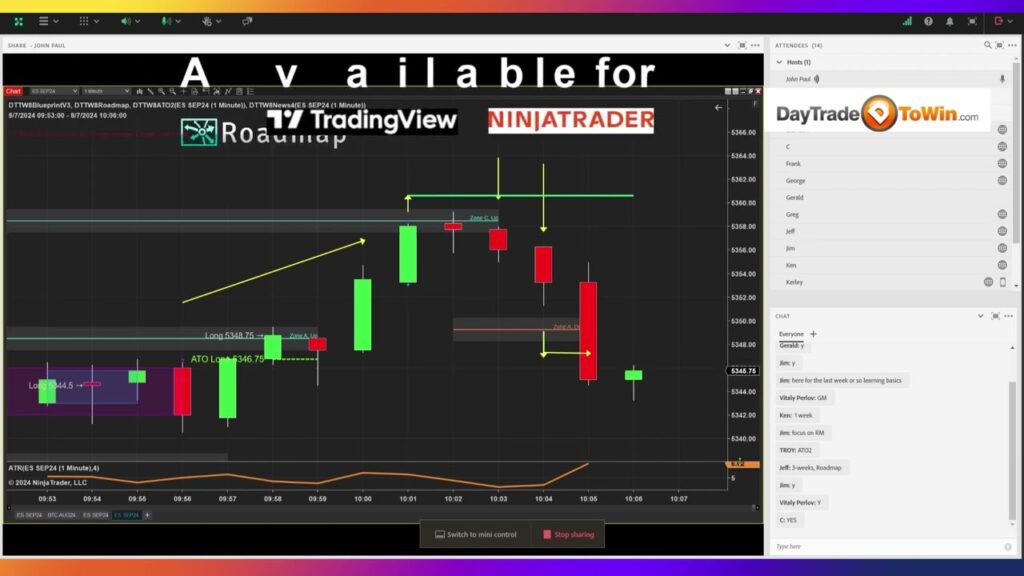
Trading during the market open is an exciting yet challenging endeavor. The first few minutes can set the tone for the day, offering significant opportunities for profit if you have the right strategy in place. Whether you’re new to trading or looking to sharpen your skills, this guide will walk you through the essential strategies to navigate the market open effectively, focusing on the “roadmap” and “at the open” methods. Understanding the Roadmap: Your Trading Compass The roadmap is a crucial tool for traders, especially during the volatile market open. It helps you identify key zones where the price might reverse or break through, allowing you to make informed trading decisions. How to Use the Roadmap At the market open, watch closely as the candles approach the roadmap zones. These zones act as potential turning points or breakout levels. Adapting to Volatility During high volatility, adjust your strategy to maintain control. Consider switching to shorter time frames, like a 20 or 30-second chart, to pinpoint more precise entry points. Key Points: The “At the Open” Strategy: Capturing Early Momentum The “At the Open” strategy is designed to help you capitalize on the initial volatility when the market opens. This method focuses on identifying a precise entry point based on early price action and placing a limit order near that level. How to Execute the “At the Open” Strategy Managing Risk with ATR and Time-Based Stops Conclusion Trading the market open requires a disciplined approach and a solid understanding of your tools. Whether you’re using the roadmap to identify key levels or applying the “At the Open” method to catch early moves, staying focused and managing risk are critical. For those looking to deepen their trading skills, consider joining our live trading room where we apply these strategies in real-time. Visit DayTradeToWin.com to create a free account, access free trading tools, and start mastering your market open strategies.