A Surprising Turn on Wall Street: What It Means for Your Investments
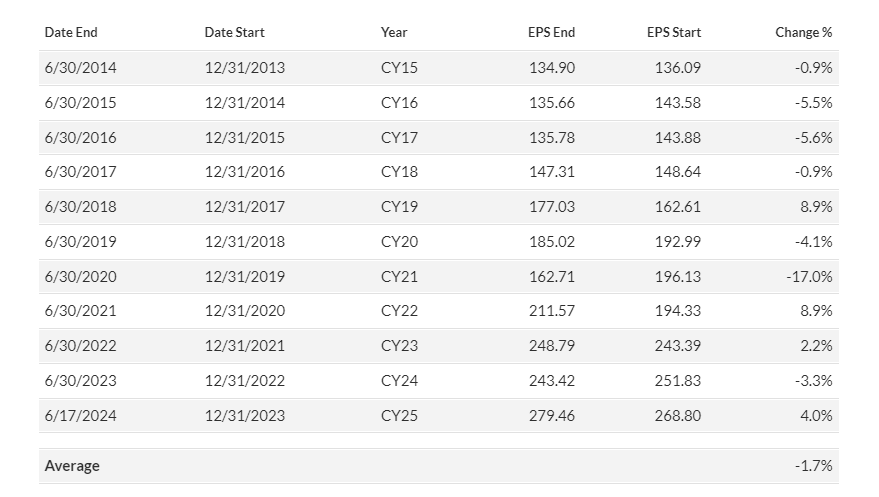
Something unusual is happening on Wall Street, boosting the confidence of stock-market bulls as the first half of 2024 draws to a close. Corporate-earnings estimates, which typically decline throughout the year, are actually growing, according to FactSet data. John Butters of FactSet shared with MarketWatch that S&P 500 firms have seen their earnings-per-share estimates for 2024 increase by 2.4% since late December, reaching $244.79. In contrast, bottom-up estimates have typically fallen 2.6% on average during the first six months over the past decade. Estimates for 2025 are also rising, up 4% to $279.46, compared with an average decline of 1.7% for the second year out. Analysts expect the S&P 500 to report year-over-year earnings growth of 11.3% in 2024 and 14.4% in 2025. This optimism is strengthening bullish investors’ confidence despite a growing list of concerns from market skeptics. Common concerns include high valuations for large-cap stocks, the S&P 500’s dependence on Nvidia Corp., political risks related to the upcoming U.S. election, and uncertainty around the Federal Reserve’s interest-rate cut, even as data suggest the U.S. economy is straining under high interest rates. Despite these worries, many Wall Street strategists are optimistic, with several recently raising their price targets for 2024, citing rising corporate forecasts to support their positive outlooks. “We’ve been surprised by how rapidly expectations for earnings have grown,” said a team at Capital Economics on Friday, announcing their decision to raise their 2024 price target for the S&P 500 to 6,000. Expectations vs. reality To be sure, earnings expectations are merely that — expectations. Typically, Wall Street’s forecasts for the largest companies are too conservative. This was evident in the first quarter when S&P 500 firms outperformed estimates, mainly due to contributions from Nvidia and other giants like Microsoft Corp. The return to strong earnings growth in the first quarter marked a significant shift from 2023, when an “earnings recession” led to just 1% growth. Despite this turnaround, some skeptics worry that the AI boom has introduced uncertainty to Wall Street’s earnings outlook. The timing of AI’s promise to boost productivity remains unclear, and so far, aside from Nvidia and a few semiconductor companies, few firms have significantly benefited from AI. The Capital Economics team acknowledged the risk of overly optimistic earnings expectations but saw no reason to doubt them, given the strong performance in the first quarter. Wall Street does not expect Nvidia and its peers to sustain their rapid earnings growth. Consensus forecasts for the S&P 500 suggest that the top 10 stocks’ contribution to overall earnings growth will decline in the second half of 2024, while contributions from the other 493 companies will rise. This trend is expected to continue into early 2025. The big question: Can margin growth keep up? Bearish investors see a potential inconsistency between earnings expectations and sales growth. FactSet estimates suggest sales will grow by just 5% in 2024 and 5.8% in 2025, meaning companies will need to expand net margins to meet profitability targets. Lisa Shalett, chief investment officer of Morgan Stanley Wealth Management, noted that consumer prices are no longer rising faster than wholesale prices, limiting companies’ pricing power. Any further margin expansion will likely require cost-cutting, lower labor costs, or increased productivity, Shalett said. Some previously skeptical investors are becoming more optimistic about margin expansion. S&P 500 companies reported an aggregate net profit margin of 11.8% for the first quarter, close to the record 12.2% margin in 2021, according to FactSet. This convinced James Abate, fund manager of the Centre American Select Equity Fund, that large American companies might continue expanding their margins in the coming quarters. He previously viewed this as a potential hurdle for the rally. “I’m becoming more optimistic about it,” Abate told MarketWatch. U.S. stocks traded mixed on Monday, with the S&P 500 losing 0.3% to 5,447.87 and the Nasdaq Composite shedding over 192 points, or 1.1%, to 17,496.82. Both indexes were affected by a 6.7% decline in Nvidia shares, officially entering correction territory. The Dow Jones Industrial Average, meanwhile, gained over 260 points, or 0.7%, to close at 39,411.21.