Nvidia Sets a New Benchmark in the Chip Sector with Its Latest Stock-Price Target
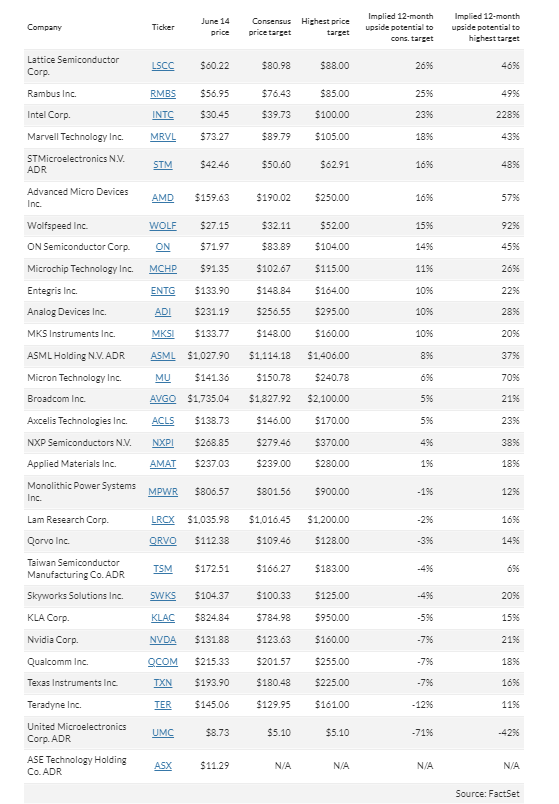
Nvidia’s new highest stock-price target suggests a 21% upside from Friday’s close, but several other chip stocks have even more bullish targets indicating greater growth potential. Nvidia Corp. shares have surged 165% this year, yet Susquehanna analyst Chris Rolland believes they can go higher. He raised his price target on Nvidia’s stock (NVDA) to $160 from $145, suggesting a 21% increase from Friday’s closing price. This target is based on a multiple of about 51.5 times his estimated adjusted earnings per share for 2025. “While this multiple is higher than the group median of ~28.5x, we view it as warranted due to Nvidia’s strong position in flourishing end markets,” Rolland wrote. Over three-quarters of analysts polled by FactSet rate Nvidia’s stock as a buy. However, the average price target is below Friday’s closing price, likely because some analysts haven’t updated their models following the stock’s recent 40%-plus rally. Despite Rolland’s optimism, his target is now the highest on FactSet. Three stocks within the PHLX Semiconductor Index have average price targets implying at least a 23% upside: Lattice Semiconductor Corp. (LSCC), Rambus Inc. (RMBS), and Intel Corp. (INTC). The table below lists all stocks in the index, sorted by their 12-month upside potential based on average and highest analyst price targets. Lattice, Rambus, and Intel have struggled this year, with Lattice down 13%, Rambus down 18%, and Intel down 39%. Analysts are generally positive about Lattice and Rambus, with 71% of FactSet-tracked analysts giving buy ratings for each. Lattice’s average price target suggests a 26% upside, while Rambus’s suggests 25%. Intel’s outlook is more mixed. Despite an average price target suggesting a 23% rise, only 28% of analysts surveyed by FactSet are bullish. Of the 47 analysts, 13 have buy ratings, 30 have neutral ratings, and four have sell ratings. Conversely, 11 stocks in the PHLX Semiconductor Index have average price targets implying negative returns. Many of these cases likely reflect outdated models, as analysts hold majority bullish ratings on seven of these stocks. Half of the stocks in the PHLX Semiconductor Index have high price targets implying more upside than Nvidia’s. Intel leads with a target suggesting over 200% growth, followed by Wolfspeed Inc. (WOLF) at 92% and Micron Technology Inc. (MU) at 70%.