daytrading

DayTradeToWin Review

Mastering Market Trends: A Comprehensive Guide to Profitable Trading Strategies

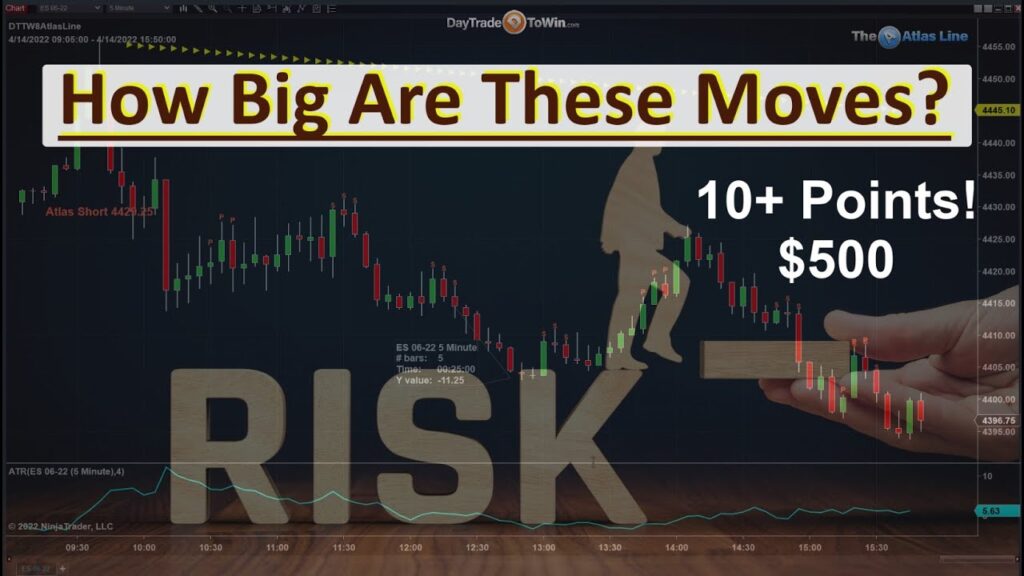
Greetings, fellow traders! In today’s blog installment, we delve into the second part of our series dedicated to forecasting market trends and strategically capitalizing on them. If you haven’t caught up with our initial discussion, be sure to follow this link for a comprehensive overview of forecasting in the dynamic world of financial markets. Let’s now turn our attention to a retrospective glance at the NASDAQ’s journey throughout the eventful 2023. From the peaks of January to the closing chapters of December, we’ll unravel key strategies designed to decode market movements and, more importantly, leverage these insights for optimal gains. A pivotal element in our approach is identifying the establishment of new highs. For instance, the indication of a higher close than open in January 2023 serves as a promising signal for a potential upward trend throughout the year. However, impulsive actions are not part of our playbook. Patience takes center stage as we await a retracement – typically spanning four or five days of pullback – post the initial surge. Whether your preference lies in utilizing indicators or focusing on price action, this method underscores a disciplined approach to entering the market. Refining our entry tactics, we introduce the 50% retracement tool. By patiently waiting for the market to surpass the 50% mark and close above it, we ensure a more robust confirmation of the anticipated upward trend, minimizing false starts. Our strategy also involves vigilant observation for double tops, where a distinct retracement occurs. This approach aims to capitalize on the market’s inclination to test previous highs, providing an opportune moment for profitable trades. In navigating market psychology, we recognize the “Stochastic Pop” phenomenon – an acceleration in the opposite direction once highs are breached. Leveraging this occurrence, often triggered by stop-loss orders, allows for swift market movements in our favor. This strategy’s versatility extends beyond the NASDAQ, applying seamlessly to various markets. As a brief illustration, we explore the E-mini S&P, showcasing how these principles can be replicated across diverse financial instruments. Recognizing the importance of exit strategies, we emphasize that exiting a trade is as pivotal as entering one. If the market deviates from the anticipated trajectory within a few days, prudence dictates a reconsideration. Closes below the midpoint or prolonged periods trading beneath it signal a potential shift, prompting a strategic exit. As we bid adieu to 2023, the insights gained from our market analysis serve as invaluable tools for navigating the upcoming year. Stay tuned for forthcoming updates and analyses as we embark on the exciting journey that is 2024. In conclusion, trading is an ever-evolving art requiring a fusion of technical analysis, strategic patience, and a profound understanding of market psychology. Here’s to prosperous trades and a triumphant 2024! Happy trading, everyone! John PaulJohn Paul is the founder of DayTradeToWin, a trading education and software company established in 2008, supporting traders worldwide. His expertise focuses on price action-based futures trading strategies and structured market analysis. DayTradeToWin delivers trading education, indicators, and software tools designed to help traders apply disciplined, rule-based decision-making across global futures markets. He is the creator of multiple trading methodologies, including the Sonic System, Atlas Line, and Trade Scalper, which help traders identify structured opportunities in markets such as the E-mini S&P 500 (ES), Nasdaq (NQ), crude oil (CL), and gold (GC). Official website: https://daytradetowin.com daytradetowin.com

DayTradeToWin Review

Navigating Markets with Precision: Trading with Less Risk ?

Greetings fellow traders! Today, we embark on an exploration of the dynamic realm of day trading, with a keen focus on the E-mini S&P. As we delve into potential opportunities for both long and short positions, it’s paramount to bear in mind the inherent risks associated with trading. Trade wisely, only utilizing funds you can afford to part with. Now, let’s delve into our market analysis. Before we immerse ourselves in the details, let’s acknowledge the pivotal role of market volatility. Armed with a five-minute chart, I am meticulously scrutinizing the market’s intricacies. Whether we’re examining the E-mini, Nasdaq, or Euro, a profound comprehension of volatility is indispensable. While larger market moves may seem formidable, our strength as traders lies in adaptability. Despite the Atlas Line signaling a short position, I swiftly transition to a one-minute chart to unveil more modest yet equally lucrative opportunities. The diminished volatility translates to reduced risk, enabling more precise entries and exits. Each trade hones in on 2-3 points, mitigating financial exposure and enforcing a disciplined approach. Chart Analysis and Risk Management A closer inspection of today’s chart reveals an array of signals, including pullback and strength trades. On the one-minute chart, the Atlas Line expertly navigates us through these opportunities, highlighting smaller targets and stops. The objective is consistent profitability with minimized risk on each trade, fostering a sustainable trading strategy. Reflecting on yesterday’s trading, we encountered both short and long signals. The Atlas Line‘s precision is evident in its ability to shepherd traders through the market’s twists and turns. Each signal epitomizes a meticulously calculated move, with the average true range serving as a valuable tool for gauging potential profits. The Atlas Line Strategy The crux of the Atlas Line strategy lies in market positioning relative to the Atlas Line. Trading above it prompts a focus on buying opportunities, guided by precise signals. Conversely, when trading below, a shift towards short positions is warranted. The Atlas Line furnishes a comprehensive approach, delineating entry points, stops, and targets. If you find yourself intrigued and laden with questions, don’t hesitate to visit daytradetowin.com. Reach out to us via our contact form or give us a call to ensure that day trading aligns seamlessly with your aspirations. Explore our complimentary workshop and contemplate joining our mentorship class, which encompasses all courses and software at a discounted rate – the Accelerated Mentorship. Conclusion In the ever-evolving realm of day trading, mastery of the art lies in strategic thinking, adaptability, and meticulous risk management. Until our next encounter, may your trading endeavors be prosperous! For those new to day trading, explore the myriad benefits at daytradetowin.com and subscribe to our YouTube channel for invaluable insights into the art of prospering from trading. John PaulJohn Paul is the founder of DayTradeToWin, a trading education and software company established in 2008, supporting traders worldwide. His expertise focuses on price action-based futures trading strategies and structured market analysis. DayTradeToWin delivers trading education, indicators, and software tools designed to help traders apply disciplined, rule-based decision-making across global futures markets. He is the creator of multiple trading methodologies, including the Sonic System, Atlas Line, and Trade Scalper, which help traders identify structured opportunities in markets such as the E-mini S&P 500 (ES), Nasdaq (NQ), crude oil (CL), and gold (GC). Official website: https://daytradetowin.com daytradetowin.com

Market News

S&P 500 Poised for a Record-Breaking Surge, Predicts Market Strategist

Crucial Insights for Today’s U.S. Trading Session As we approach the end of 2023, investors might contemplate staying on the sidelines given recent market fluctuations and the lofty expectations associated with the elusive Santa Rally. Nevertheless, the outlook seems positive for the upcoming Tuesday trading session in this abbreviated week. Following the release of significant inflation data, attention now turns to key indicators like U.S. housing data and weekly jobless benefit claims in the days ahead. The prevailing theme in recent weeks centers around the anticipation of Federal Reserve interest rate cuts in the coming year, with projections suggesting up to seven cuts in 2024. Despite some cautionary notes about this optimism, short-term market momentum appears likely to persist as investors enthusiastically embrace the current euphoria, as per insights from The Kobeissi Letter’s Adam Kobeissi. Kobeissi observes that the S&P 500 has displayed a clear disregard for overbought technical indicators, maintaining a consistent upward trajectory in price action. The strategist points to sustained optimism regarding geopolitical stability and the significant dip in oil and commodity prices as factors supporting equities into the New Year. Notably, crude oil prices have seen an over 8% decrease in 2023. While Kobeissi acknowledges lingering concerns about inflation, he emphasizes that short-term market momentum is fueled by investor expectations of the impending shift in Fed policy. Taking a closer look at the technical aspects, Kobeissi notes that the S&P 500 briefly surpassed 4,770 on December 20 before experiencing a rapid 80-point drop. As of the latest data, the index is a mere 0.8% away from its recent record close of 4,796.56 on January 3, 2022. Analyzing indicators like the daily RSI and Bollinger Bands, Kobeissi suggests that while some overbought conditions exist, the momentum signals remain robust. Looking forward, Kobeissi anticipates a move into new all-time high territory for the S&P 500, projecting a breakthrough above the previous record of 4,818. He expresses a bullish sentiment with a target of 4,820 and a stop-loss at 4,690, predicting a potential move above 4,780 as early as this week. John PaulJohn Paul is the founder of DayTradeToWin, a trading education and software company established in 2008, supporting traders worldwide. His expertise focuses on price action-based futures trading strategies and structured market analysis. DayTradeToWin delivers trading education, indicators, and software tools designed to help traders apply disciplined, rule-based decision-making across global futures markets. He is the creator of multiple trading methodologies, including the Sonic System, Atlas Line, and Trade Scalper, which help traders identify structured opportunities in markets such as the E-mini S&P 500 (ES), Nasdaq (NQ), crude oil (CL), and gold (GC). Official website: https://daytradetowin.com daytradetowin.com

Market News

Post-Christmas Magic: When Santa Claus Visits Wall Street

The market’s favorable prospects extend into the initial days of January, marking this period—from the end of Christmas to the first two trading sessions of the new year—as the Santa Claus Rally with strong statistical support, as defined by the Stock Trader’s Almanac. Out of 127 instances since the inception of the Dow Jones Industrial Average in 1896, the rally has occurred in 98 cases, translating to a 77% success rate. It’s essential to exercise caution and avoid risking entire retirement portfolios, but for those with a separate fund for speculative endeavors, the current market conditions may present an opportunity worth considering. While historical data showcases the market’s tendency to outperform during this season compared to the rest of the year, it’s crucial to acknowledge that statistical significance, present at the 95% confidence level, doesn’t guarantee success in any given Santa Claus Rally. The enduring appeal of this seasonal pattern is partially attributed to the tendency of many investors to shift their focus away from the market during year-end, prioritizing family and reflections. This differs from other patterns that often lose effectiveness as increased exploitation attempts diminish their reliability. Despite a robust performance and record highs in some major averages throughout the year, historical data suggests that the odds of a Santa Claus Rally aren’t significantly elevated during years with positive year-to-date gains through Christmas. In such years, the market has risen 79% of the time, a statistically marginal difference from the overall 77% odds across all years. It’s crucial to recognize that even with favorable statistical trends, there remains a one-in-four chance of experiencing losses during any specific Santa Claus Rally period. John PaulJohn Paul is the founder of DayTradeToWin, a trading education and software company established in 2008, supporting traders worldwide. His expertise focuses on price action-based futures trading strategies and structured market analysis. DayTradeToWin delivers trading education, indicators, and software tools designed to help traders apply disciplined, rule-based decision-making across global futures markets. He is the creator of multiple trading methodologies, including the Sonic System, Atlas Line, and Trade Scalper, which help traders identify structured opportunities in markets such as the E-mini S&P 500 (ES), Nasdaq (NQ), crude oil (CL), and gold (GC). Official website: https://daytradetowin.com daytradetowin.com

Market News

Santa Claus Rally: Managing Expectations for the Year-End Stock Market Boost

Pete Biebel from Benjamin F. Edwards suggests that a portion of Santa’s generosity may have already been distributed, indicating a potential early start to the anticipated Santa Claus rally on Wall Street. This traditional rally is characterized by the stock market‘s tendency to ascend during the final five trading days of the current year and the initial two sessions of the new year, as defined by the Stock Trader’s Almanac. This year’s rally spans from Friday to Wednesday, January 3. Historical patterns indicate that stocks might experience positive momentum in the next six trading days, given the consistent occurrence of the Santa rally almost every year. Since 1950, the S&P 500 has, on average, seen a 1.3% increase over this seven-day period, with a 78% higher closure rate during the Santa Claus trading window in the past 75 years, and gains observed over the last seven years, according to Dow Jones Market Data. However, this time, the stock market has already seen significant gains before Christmas, prompting some analysts, including Ed Yardeni of Yardeni Research, to suggest that the Santa rally has arrived “ahead of schedule.” Despite the upbeat market mood, Pete A. Biebel notes that the market may be somewhat extended, tempering expectations for the traditional Santa rally period. The midweek dip on Wednesday, resulting in the Dow Jones Industrial Average’s largest one-day percentage decline since October, serves as a cautionary signal. Biebel suggests that the market’s buoyancy might be showing signs of potential trouble beneath the surface, emphasizing the need to dial back expectations for the traditional Santa rally. While the recent pullback lacked a clear fundamental trigger, some attribute it to increased trading of zero-day to expiry options (0DTE). Analysts also point to overbought technical conditions and low year-end trading volumes as contributing factors. Despite the caution, some analysts advise against betting against the seasonal momentum, especially in a bull market with a strong uptrend. Historical data shows a correlation between stock-market returns during this period and returns in January and the subsequent year. The potential for a Santa rally exists, but analysts anticipate a possible hangover and reset in January or February due to overbought conditions. In summary, the market finished mostly higher on Friday, capping an eighth consecutive positive week for major indexes. Whether investors will receive the expected seasonal presents in 2023 or face challenges from an extended rally remains uncertain, emphasizing the speculative nature of the Santa rally. John PaulJohn Paul is the founder of DayTradeToWin, a trading education and software company established in 2008, supporting traders worldwide. His expertise focuses on price action-based futures trading strategies and structured market analysis. DayTradeToWin delivers trading education, indicators, and software tools designed to help traders apply disciplined, rule-based decision-making across global futures markets. He is the creator of multiple trading methodologies, including the Sonic System, Atlas Line, and Trade Scalper, which help traders identify structured opportunities in markets such as the E-mini S&P 500 (ES), Nasdaq (NQ), crude oil (CL), and gold (GC). Official website: https://daytradetowin.com daytradetowin.com

DayTradeToWin Review

Investment Insights: Was the Midweek Dip a Brief Setback or the Start of a Larger Shift?

U.S. stocks were facing the potential for a technical pullback following a swift rally from October lows. However, the sudden downturn on Wall Street this Wednesday has led traders and analysts to consider whether more challenges lie ahead. Examining numerous charts, Mark Arbeter, President of Arbeter Investments and a technical analyst, remarked, “Some Technology stocks are extremely extended, and many of the laggards from 2023 have also shown significant extensions after substantial recoveries. This leaves few appealing charts, at least in the short term,” as noted in a Thursday communication. Arbeter added, “So, this was either a one-day wonder or the start of a decent pullback.” On Wednesday, the Dow Jones Industrial Average (DJIA) experienced a substantial drop of 475.92 points, or 1.3%, marking its most significant one-day percentage decline since October 3. This ended a five-day streak of record highs. The S&P 500 (SPX), which had approached its January 3, 2022, record close, retreated 1.5%, closing just below 4,700—the most substantial percentage decline since September 26. Simultaneously, the Nasdaq Composite (COMP) saw a 1.5% drop, the largest since October 26. Despite a partial recovery in all three major indexes on Thursday, Arbeter identified trendline support for the S&P 500 at 4,675, with the rising 21-day exponential moving average at 4,621. Stressing the significance of 4,600 as a crucial chart support level, he noted it marked the beginning of the last upside breakout. Both the Dow and Nasdaq had rallied for nine consecutive days before Wednesday’s setback. While the surge had rendered major indexes considerably overbought based on technical indicators, Arbeter noted that not all signs were pointing downward. Although price momentum and market breadth were extremely overbought, the absence of daily bearish momentum divergences and the continuation of strong breadth offered some positive indicators. Arbeter highlighted that the percentage of S&P 500 stocks above their 50-day moving average had spiked to 91%, while the Nasdaq-100-tracking Invesco Trust QQQ Series ETF (QQQ) recorded a 95% reading on December 19. Referring to historical data since the end of 2001, Arbeter mentioned that such “breadth thrusts” typically occur in the early or middle stages of a bull market, with a cautionary note on the exceptions in October 2007 and January 2018. Despite the likelihood of a near-term pullback, Arbeter expressed optimism about the bull market’s potential to continue based on price and breadth indicators. John PaulJohn Paul is the founder of DayTradeToWin, a trading education and software company established in 2008, supporting traders worldwide. His expertise focuses on price action-based futures trading strategies and structured market analysis. DayTradeToWin delivers trading education, indicators, and software tools designed to help traders apply disciplined, rule-based decision-making across global futures markets. He is the creator of multiple trading methodologies, including the Sonic System, Atlas Line, and Trade Scalper, which help traders identify structured opportunities in markets such as the E-mini S&P 500 (ES), Nasdaq (NQ), crude oil (CL), and gold (GC). Official website: https://daytradetowin.com daytradetowin.com

Scroll to Top