Dow
Market News

Dow 60,000 and S&P 500 8,000? A Massive Earnings Surge Might Make It Happen

Last week, the Dow Jones Industrial Average surpassing 40,000 marked a significant milestone for investors. However, top Wall Street forecaster Ed Yardeni envisions even larger gains ahead, driven by strong earnings. Ed Yardeni, chief investment strategist at Yardeni Research, informed clients that the DJIA could surge by 50% to reach 60,000 by 2030, while the S&P 500 might climb to 8,000. The Dow closed above 40,000 for the first time on Friday. This forecast implies a 7% compound annual growth rate for the Dow and 7.1% for the S&P 500. Yardeni stated, “These targets could be met with a forward P/E of 20 and forward earnings at $400 per share, up 60% from an estimated $250 per share this year. We believe this is achievable in our Roaring 2020s scenario.” Yardeni’s Roaring 20s scenario assumes S&P 500 companies will report annual earnings per share growth of at least 8.8%, the historical average since 1936. If the growth rates of nominal and real GDP exceed their post-1940s averages of 6.3% and 3.1%, respectively, EPS growth could accelerate. According to Yardeni, “This could happen if productivity grows faster than its 2.0% average since 1951, as we expect in our Roaring 2020s scenario. Higher-than-expected productivity growth would lead to higher-than-expected real GDP growth, lower unit labor costs, increased wages relative to prices, and improved profit margins.” Industry analysts are increasingly optimistic, with consensus revenue and earnings estimates suggesting profit margins of 12.6% this year, rising to 13.6% and 14.4% over the next two years. Last December, Yardeni predicted the S&P 500 would reach 6,000 within two years. He accurately forecasted a rally for the index last year, and his 5,400 target for the S&P 500 for 2024 is among the highest on Wall Street.

S&P 500
Market News

Resist the FOMO: Navigating S&P 500 Records Without ‘Envy

When stocks are booming and bonds are lagging, as they are now, it can be tough to convince investors that diversification is still essential. With the S&P 500 up nearly 12% year-to-date in mid-May and the Dow Jones Industrial Average hitting 40,000, many investors experience “S&P 500 Envy” if their returns fall short of these benchmarks. This sentiment wasn’t an issue in recent years when both stocks and bonds were down, but a similar situation occurred in 2018, fostering the “S&P 500 Envy” concept. BlackRock even created a presentation to help financial advisers address this with clients, demonstrating that while a diversified portfolio might underperform the S&P 500 in the short term, it often yields better long-term results. A key graphic from this presentation showed that during years like 2000-2002, 2008, 2020, and 2022, when the S&P was down, a diversified portfolio also declined but by a smaller margin, leading to investor dissatisfaction. Conversely, from 2009 to 2019 and in 2023, when the S&P surged, a diversified portfolio grew more modestly, causing envy. Over the long run, however, the diversified portfolio outperformed the S&P, proving that “diversification can work, even when it feels like it’s losing.” Nicholas Olesen, a certified financial planner with Kathmere Capital Management, reinforces this point. He advises that diversification hedges against economic fluctuations and addresses recency bias, the tendency to believe recent trends will continue indefinitely. Olesen emphasizes the importance of a balanced approach tailored to individual investor needs and sticking to this plan despite market volatility. Ross Haycock, a certified financial planner with Summit Wealth Group, also champions diversification, invoking the timeless wisdom: “Don’t put all your eggs in one basket.” He notes that diversification discussions are easier with long-term clients who have experienced market cycles, while newer clients may need more reassurance during turbulent times. One common mistake investors make when shunning diversification is focusing solely on bond prices rather than yields. Despite bonds underperforming in recent years, they still generate consistent, guaranteed yields, especially when held to maturity. Olesen warns against “statement shock,” where investors see a small daily return and compare it unfavorably to the S&P’s gains without considering the overall yield and long-term value. Advisers stress the importance of following a well-considered plan and avoiding hasty decisions based on short-term market movements. By doing so, investors can avoid FOMO and ensure their portfolios are well-positioned for long-term success.

Dow Jones
Market News

Record-Breaking Moment: Dow Jones Surpasses 40,000, Fails to Maintain

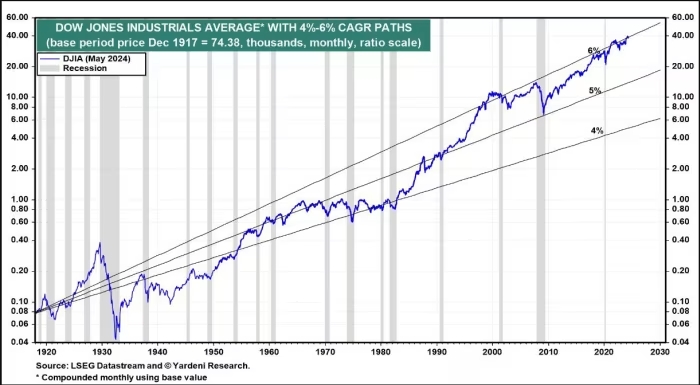
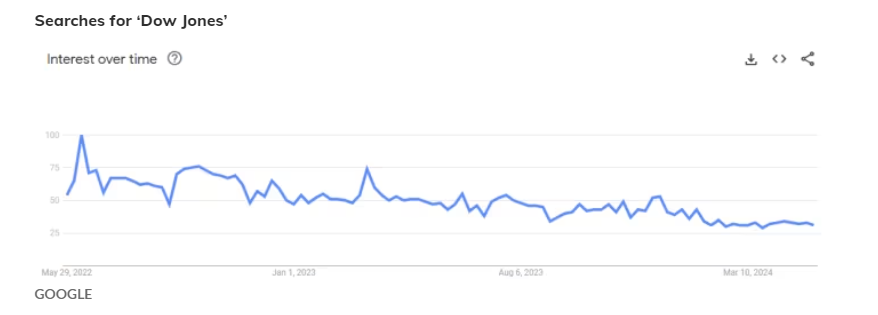
Hold on to your hats. The Dow Jones Industrial Average briefly traded above 40,000 for the first time ever on Thursday but ended the day shy of a milestone that investors said could further boost bullish spirits on Wall Street. “Breaking the 40,000 barrier is a big psychological boost for the bulls, as round numbers hold special significance in people’s hearts and minds,” Chris Zaccarelli, chief investment officer for Independent Advisor Alliance, said in emailed comments. The Dow closed the day near 39,869, a loss of around 39 points, or 0.1%, after hitting a session high of 40,051.05 around 11 a.m. Eastern time. Big, round-number milestones can attract attention to a market rally. Indeed, it’s hard to overstate the hype that accompanied the Dow’s first-ever push above the 10,000 level on March 29, 1999. The move spawned a cottage industry in commemorative merchandise, particularly hats emblazoned with “Dow 10,000” that can still be found on eBay. The prospective Dow 40,000 milestone, however, isn’t prompting Americans to party like it’s 1999. Public interest in the record stock-market rally appears tepid at best, analysts have noted. The Dow, dating back to 1896, remains the measuring stick of the U.S. stock market among the general public, although investment professionals view the S&P 500, launched in 1957, as the true large-cap benchmark. Searches for “Dow Jones” on Google have trended consistently lower since peaking in June 2022, which marked an initial low in that year’s brutal selloff, observed Nicholas Colas, co-founder of DataTrek Research, in a note last week. The peak in searches came as the Federal Reserve was preparing to launch a series of outsized interest-rate increases. As stocks sank amid rising recession fears, the American public took notice, Colas said. Since then, interest has trailed off even as stocks have returned to record territory. “To the degree to which Americans think the stock market is a sign of general economic health, they are not seeing what could be considered an upbeat message,” he wrote. “The idea that stock prices are a transmission mechanism between markets and consumers only seems to work in one direction.” For investors, meanwhile, there may be little to glean from such advances in themselves. “I think, if anything, it’s more nostalgic and symbolic than it is a meaningful tell for a professional investor,” Eric Freedman, chief investment officer at U.S. Bank Wealth Management, said in a phone interview in March, when the Dow came within a whisker of the 40,000 threshold but failed to surpass it. The Dow’s attempted push above 40,000 comes amid a broader rally that saw the blue-chip gauge, the S&P 500, and the Nasdaq Composite all close at record highs on Wednesday. The S&P 500 cleared a big milestone of its own earlier this year, topping the 5,000 level for the first time. Historic advances for the S&P 500 tend to garner less attention than those for the Dow, even though the S&P 500 is far more relevant, representing a much bigger portion of the investable U.S. stock market. The Dow ended above the 30,000 milestone for the first time on Nov. 24, 2020, after stocks roared back from the pandemic bear market seen earlier in the year. Including Thursday, it’s been 873 trading days since the Dow first ended above 30,000, according to Dow Jones Market Data. It took the blue-chip gauge 966 days to clear the 30,000 milestone after first closing above 20,000 on Jan. 25, 2017. Of course, each successive milestone is less impressive in percentage terms. The move from 30,000 to 40,000 represents a 33.3% gain. It took a 4,486 trading-day journey for the blue-chip gauge to double from 10,000 to 20,000. While 10,000-point milestones aren’t frequent occasions, it’s easy to see why the first push above 10,000 seemed special. It took over a century—28,313 trading days to be exact—for the gauge to enter five-digit territory. Meanwhile, public indifference to the 40,000 milestone may carry at least one bullish, contrarian implication for the market, said DataTrek’s Colas: “No one can accuse the recent U.S. equity market rally of being fueled by rampant interest in stocks. This is not the 1990s. Not even close.”

DayTradeToWin Review

Dow Jones Hits 40K! Is It Time to Buy or Sell? ?

Today is Wednesday, May 16th, and we’re going to talk about the Dow Jones, its recent all-time highs, and what might happen next. This analysis will help you prepare for the rest of May. Before we begin, please remember that trading involves risk. Do not trade with funds you cannot afford to lose. Dow Jones Reaches All-Time High The Dow Jones cash index made an all-time high today, crossing the significant 40,000 mark. Whole, even numbers like 40,000 often influence market sentiment due to their psychological impact. However, after reaching this milestone, the index started to pull back in after-hours trading. This pullback forms what is known as a “double top” pattern, which can signal a potential reversal or a pause in the upward trend. Futures Market Analysis When we look at the Dow Jones Futures (YM), we see a different picture. The YM did not reach an all-time high or form a double top. This divergence between the cash index and the Futures market is significant and suggests two possibilities: Market Outlook Given the current market conditions and the psychological impact of the 40,000 mark, a pullback seems likely before any further upward movement. This means we could see another buying opportunity later in the year, possibly towards the end of 2024. Day Trading Strategies For day traders, it’s crucial to use different strategies to capitalize on these market movements. Here are some effective methods: Combining these methods can provide a robust trading strategy, whether you’re trading the E-mini S&P 500, Dow Jones, or NASDAQ. Conclusion If you have any questions, visit DayTradetoWin and sign up for a free member account. They offer free software for NinjaTrader and TradingView, including the ABC and News indicators. Until next time, good trading! If you want to learn more about trading price action, check out our next video, like, and subscribe to our channel. Happy Trading!

inflation data
Market News

Inflation Data Released Ahead of Schedule, Markets Shrug

Data on U.S. consumer prices, the most anticipated report of the month, was released early, yet it appears the market didn’t notice. The Bureau of Labor Statistics (BLS) reported that a subset of the files was accidentally posted on its website about 30 minutes before the scheduled release time, around 8 a.m. Eastern. The BLS did not clarify which data were released or if this subset would have been sufficient for informed investors to take action. An investigation is now underway. “BLS has alerted the Office of Management and Budget and the Department of Labor’s Office of the Inspector General about the incident. BLS takes its data security seriously and is conducting a full investigation into its procedures and controls to ensure the incident is not repeated,” the agency stated. An examination of key futures contracts and currency movements showed minimal activity around 8 a.m. Eastern on Wednesday, with significant movements occurring at the official release time of 8:30 a.m. This suggests that very few, if any, investors noticed the early release. The report indicated that the Consumer Price Index (CPI) increased more slowly than expected, news that subsequently drove stocks and bonds higher.

Trading Systems
DayTradeToWin Review

Mastering Day Trading: Essential Strategies and Tools for Success

In the fast-paced world of day trading, having a solid strategy and the right tools is crucial for achieving consistent success. Whether you’re a seasoned trader or just starting, understanding the importance of setting hard stops, avoiding prolonged losing positions, and utilizing automated trading systems can significantly enhance your trading performance. This blog post explores these key strategies and tools to help you become a more effective trader. The Importance of Hard Stops and Cutting Losses One of the fundamental principles in trading is to set hard stops and adhere to them. A hard stop is a predetermined exit point to prevent further losses, helping you manage risk and protect your capital. If a trade is going to work, it should show positive movement almost immediately after you enter. Time is a critical factor in trading. If you enter a trade and it doesn’t move in your favor within a few bars, it’s a signal to cut it loose. For example, if your first trade is red and the subsequent trade is also red, it’s a bad sign. Conversely, if the trade starts moving in your favor immediately, it indicates a promising opportunity. Leveraging Automated Trading Systems Automated trading systems, such as the Trade Scalper and the Autopilot, can greatly enhance your trading efficiency. These systems generate signals based on specific criteria and execute trades on your behalf, reducing emotional stress and the time commitment of manual trading. The Trade Scalper The Trade Scalper is ideal for traders who prefer a quick in-and-out trading style. Available on platforms like TradingView and NinjaTrader, the Trade Scalper provides signals for optimal entry and exit points. For instance, a “double wick” signal suggests a potential long trade. If the trade doesn’t start moving in your favor almost immediately, it’s best to exit the trade. The Autopilot Trading System The Autopilot trading system is another powerful tool that automates your trading strategy. It analyzes the market, decides whether to buy or sell, and executes trades based on predefined settings. Key features of the Autopilot include: Practical Tips for Using Automated Systems When using automated trading systems like the Autopilot, it’s essential to: Optimal Trading Hours Timing is everything in trading. Based on experience, some of the best times to trade are between 9:55 AM and 1:50 PM Eastern Time. This window offers ample opportunities with reduced volatility compared to market opening and closing times. However, some traders prefer pre-market or overnight trading, depending on their strategy and market conditions. Conclusion Successful trading requires a combination of discipline, strategy, and the right tools. By setting hard stops, avoiding prolonged losing positions, and leveraging automated trading systems like the Trade Scalper and the Autopilot, you can improve your trading outcomes. Remember to start small, set realistic goals, and adjust your settings based on market conditions. With these strategies, you’ll be well on your way to becoming a more effective and profitable trader. For more information and to join our community of traders, visit DayTradeToWin.com and subscribe to our YouTube channel for the latest updates and trading tips. Happy trading!

Scroll to Top