Surprising Findings: The U.S. Stock Market’s Unparalleled Diversity
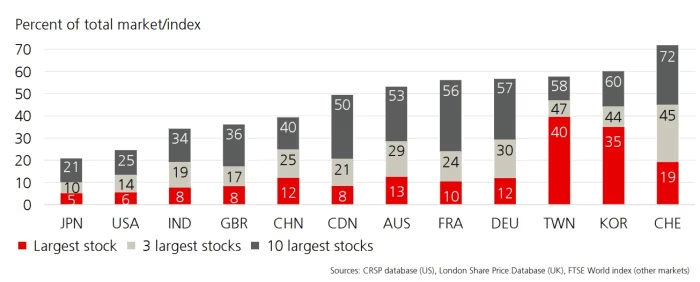
Despite the prevalent discourse surrounding the dominance of a handful of companies such as the Magnificent Seven in propelling stock-market performance, the truth reveals a different narrative: the U.S. market stands as one of the least concentrated globally. This insight stems from the latest research findings presented in the global investment returns yearbook authored by Paul Marsh and Mike Staunton of London Business School, along with Elroy Dimson of Cambridge University. The yearbook, now published at UBS following the demise of Credit Suisse, highlights the U.S. as the second-least concentrated market among the top 12 global markets. However, this observation doesn’t guarantee long-term stability. During discussions with journalists, the authors stressed the inherent uncertainty in predicting the market’s trajectory. Dimson aptly noted, “The future is very uncertain, always,” while Marsh emphasized the distinction between the present market landscape and the dot-com era, noting that today’s market leaders boast profitability, albeit with lingering concerns regarding valuation rather than the quality of fundamentals. Despite maintaining its dominance in global stock markets, comprising 61% of total market capitalization by the end of last year, the historical performance of the U.S. market may not be easily replicated in the future. Over the past 124 years, U.S. stocks have delivered an inflation-adjusted return of 6.5%, outperforming global stocks by 1.4%. However, the authors caution against expecting similar returns in the future, attributing much of the past success to generational luck rather than sustainable trends. Looking forward, they anticipate diminished returns for Generation Z compared to previous generations, forecasting annual real returns of 4.5% on stocks, 2% on bonds, and 3.5% on a 60/40 portfolio. While falling short of the returns experienced by baby boomers, this projection aligns with the stock-market performance observed by millennials.