DayTradeToWin Review

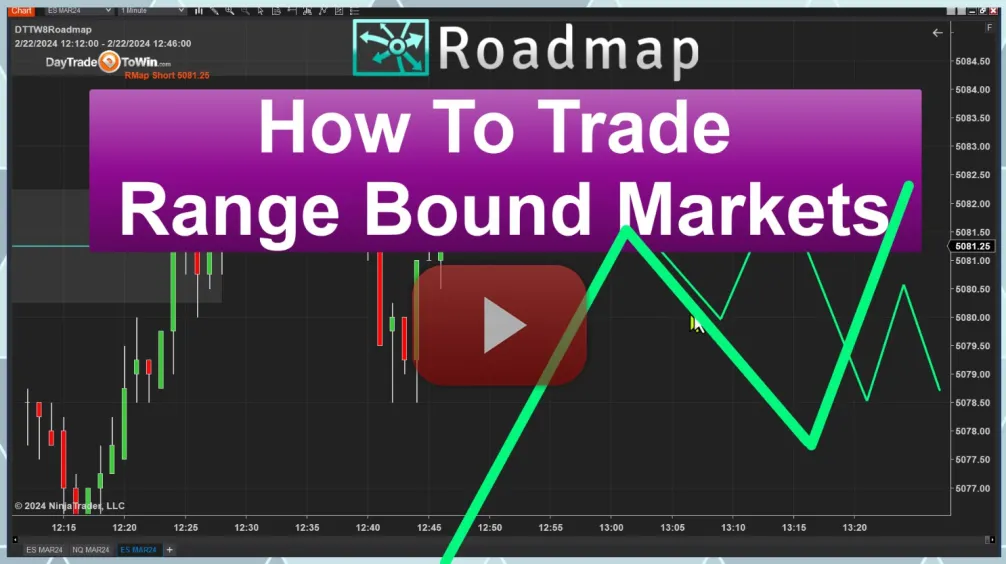
Finding Balance: Strategies for Profiting in Sideways Markets

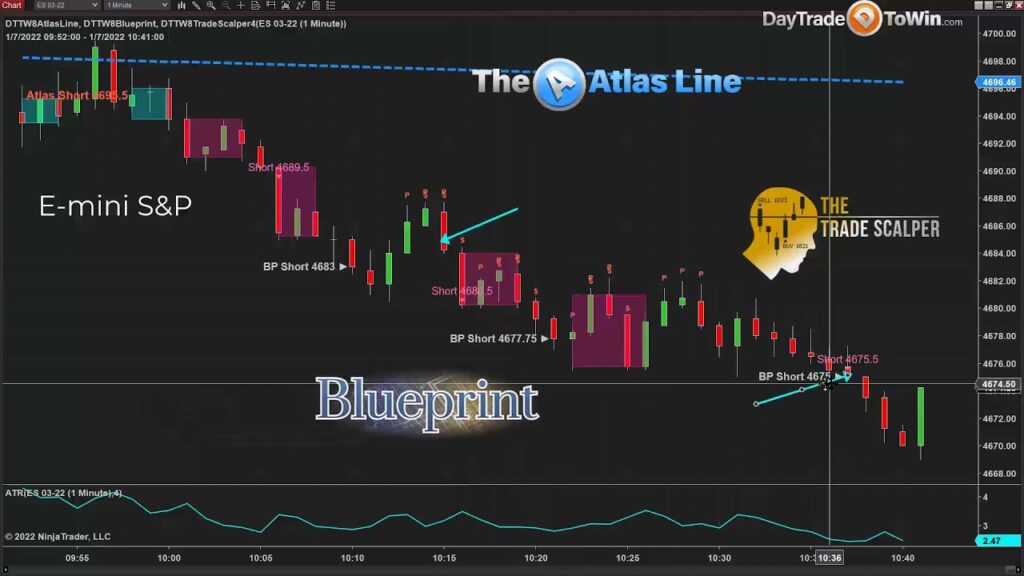
Today, on February 22nd, let’s delve into the intricate world of trading as I introduce you to a game-changing tool: the Roadmap. Developed by our expert team at DayTradetoWin, this proprietary software offers a comprehensive guide to understanding market movements with unmatched precision. Whether you’re a seasoned trader or just starting out, the Roadmap provides invaluable insights into market direction, equipping you to make informed decisions. Understanding the Roadmap The Roadmap operates on a simple yet powerful premise: identifying key zones on the chart where the market is likely to pause, reverse, or continue its current trajectory. When you add the Roadmap to your chart, you’ll immediately notice shaded areas highlighting these critical zones. These zones serve as invaluable markers, indicating potential buy or sell opportunities based on market behavior. Trading with Confidence Empowering traders to navigate the market with confidence, the Roadmap enables you to understand the significance of these zones and employ various strategies accordingly. Whether it’s counter-trend trading or trend-following, the Roadmap equips you with the tools to adapt to market conditions. For example, when the market breaches a zone and continues in the same direction, it signals a potential continuation of the trend. Conversely, if the market stalls or reverses upon reaching a zone, it presents an opportunity for counter-trend trading. Risk Management While trading presents numerous profit opportunities, it’s crucial to acknowledge the inherent risks involved. The Roadmap aids in prudent risk management by providing clear entry and exit points, allowing traders to set tight stops and manage risk effectively. Real-Life Examples To illustrate the practical application of the Roadmap, let’s analyze recent market movements. By examining charts from both today and yesterday, we can observe how the Roadmap accurately predicted market behavior, guiding traders towards profitable opportunities. Join the Community Ready to elevate your trading experience? Visit daytradetowin.com to learn more about the Roadmap and sign up for a free member account. Gain access to valuable resources, educational materials, and our live trading room, where you can interact with fellow traders and hone your skills. Final Thoughts In conclusion, the Roadmap stands as a beacon of guidance in the dynamic world of trading. With its intuitive interface and powerful insights, it empowers traders to navigate the market with clarity and precision. Remember, success in trading requires not only skill but also the right tools and mindset. Embrace the Roadmap, and embark on a journey towards trading excellence.

Market News

Economic Forecast: Strategists Signal Potential for ’70s Stagflation Replay

Equities faced difficulties while bonds excelled during the turbulent inflationary periods of the 1970s. Presently, investors are drawn to the idea of a “Goldilocks” market, but a group of quantitative strategists from Wall Street warns of a potential return to conditions reminiscent of the disco era. In a recent communication, J.P. Morgan analysts, spearheaded by the well-known strategist Marko Kolanovic, cautioned about a possible shift in market sentiment away from the current narrative of Goldilocks toward a scenario similar to the stagflation experienced in the 1970s, which could have significant consequences for asset allocation. The 1970s were marked by persistent high inflation, characterized by three distinct waves linked to geopolitical events such as the Vietnam War and conflicts in the Middle East. These events, combined with escalating government deficits, created an environment where equities saw minimal nominal gains from 1967 to 1980, while bonds and credit instruments significantly outperformed. Drawing parallels between the geopolitical landscape of the 1970s and current tensions in regions like Eastern Europe, the Middle East, and the South China Sea, the analysts pointed to recent energy crises and shipping disruptions in the Red Sea as potential indicators of historical parallels. The analysts cautioned that the escalation of tensions, particularly with China, could exacerbate inflationary pressures and trigger a market downturn. Additionally, they noted that fiscal deficits are unsustainable, raising concerns about the potential shift in the macroeconomic backdrop from the peace dividend era of the late 1980s to 2000s to a period characterized by conflict-driven inflation. In such a scenario, investors would likely favor fixed-income assets over equities, seeking higher yields to offset the effects of stagflation. Historically, during the 1970s, bonds significantly outperformed equities, with yields averaging above 7%, making any yield pickup crucial for long-term portfolio performance. Despite these warnings, current market trends show stocks rallying into 2024, with major indices reaching new milestones. However, investors remain cautious, as evidenced by their reaction to the Federal Reserve’s policy meeting minutes, indicating a readiness to reassess market dynamics in light of evolving economic conditions.

DayTradeToWin Review

Timing is Everything: The Science Behind Winning Day Trades

Hello there! Welcome back to the discussion. Today, I’m thrilled to delve into recent signals using the DayTradeToWin software. It’s endlessly intriguing to witness the market’s movements and discover how we can capitalize on them for successful trades. In this video, I’ll zoom in on a crucial aspect of trading: the significance of aligning your trades with prevailing signals rather than conflicting methods. Whether you’re following your own strategies or utilizing DayTradeToWin methods like the Blueprint, Trade Scalper, or Atlas Line, it’s vital to heed the signals they generate. As we examine today’s signals, it’s worth noting that the majority, if not all, are signaling short positions. Across various methods and instruments such as the Mini Nasdaq and E-mini S&P, consistent signals pointing towards the short side emerge. This alignment serves as a potent indicator of market sentiment, offering clarity for our trading decisions. I emphasize the importance of trading in alignment with multiple methods rather than relying solely on a single indicator. By cross-referencing signals from different sources, we enhance the likelihood of making successful trades. Some traders prefer a top-down approach, analyzing multiple time frames for insights. While effective, I find focusing on a single chart, like the one-minute chart I’m using today, provides ample information for timely decisions without overwhelming complexity. Furthermore, current market conditions support healthy trading opportunities, with favorable targets and potential profits. Each trade presents around three to four points, or approximately 13-14 ticks on the E-mini, making short positions attractive for profit-taking. While I can’t guarantee another short position during this video, the demonstration underscores prevailing market sentiment and the potential for successful trades. As always, it’s crucial to adapt and remain flexible in response to evolving market dynamics. If you’re new to day trading or seeking to refine your skills, I urge you to explore the benefits of trading the markets with DayTradeToWin. Visit our website, daytradetowin.com, to learn more about our mentorship classes and subscribe to our YouTube channel for valuable insights and strategies. Thank you for joining me today. Stay tuned for more updates, and until next time, happy trading!

Market News

Fed Minutes Anticipation: Treasury Yields Maintain Stability

There was little change in bond yields on Wednesday morning as traders waited for the Federal Reserve’s January meeting minutes to be released. What’s happening What’s driving markets Investors were hesitant to make risky investments until the minutes from the Federal Reserve’s policy meeting on January 31st at 2 p.m. Eastern time were released. In recent weeks, the 10-year Treasury yields have been gradually increasing and are now approaching the upper end of the range between 3.8% and 4.3%. This is a result of unexpected inflation and employment data, causing Federal Reserve officials to hint at a possible lack of rate cuts in March. Analysts expect that the upcoming minutes will reflect the same stance. On Wednesday, a number of Federal Reserve officials are scheduled to speak. The day will start with Atlanta Fed President Raphael Bostic’s opening remarks at 8 a.m. Eastern time, followed by an interview with Richmond Fed President Tom Barkin on SiriusXM radio at 9:10 a.m., and comments from Fed Gov. Michelle Bowman at 1 p.m. Based on the CME FedWatch tool, there is a high probability of 93.5% that the Federal Reserve will maintain interest rates at 5.25% to 5.50% following the upcoming meeting on March 20th. The likelihood of a rate cut of 25 basis points at the May meeting has decreased to 37.2% from 84.7% a month ago. The Federal Reserve is expected to reduce its Fed funds rate target to approximately 4.5% by December 2024, according to 30-day Fed Funds futures. At 1 p.m., the Treasury plans to auction off $16 billion of 20-year notes. What are analysts saying The Citi economics team, headed by Andrew Hollenhorst, expects that the Federal Reserve will make its first 0.25% interest rate cut in June, as predicted by the market. They stated that the current situation of robust job growth and elevated inflation rates presents difficulties in justifying a decrease in interest rates, and this stance will be reflected in the meeting minutes. However, a potential drop in year-over-year core PCE data could potentially convince Federal Reserve officials to cut rates, despite the ongoing economic conditions.

Market News

Wall Street’s Dangerous Dance: Expert Strategist Cautions Against Stock Meltup

Important Details for the U.S. Trading Day The mood in the U.S. trading session post-holiday appears uneasy, notably with major technology stocks like Nvidia experiencing a decline before the market opens, a day prior to highly anticipated earnings releases. Market observers, including Joe Adinolfi from MarketWatch, suggest that Nvidia’s earnings could potentially disrupt market momentum due to high expectations from investors. Ed Yardeni, president of Yardeni Research, issues a warning that not only optimistic investors but also Wall Street analysts themselves could contribute to market volatility. Yardeni points out a feedback loop phenomenon, where rising stock prices prompt analysts to revise their estimates upwards, perpetuating further price increases. Yardeni emphasizes the difficulty of resisting market trends, which often leads to dissatisfaction among followers, likening this behavior to mob psychology rather than sound financial analysis. While generally optimistic, Yardeni prefers a stable market supported by underlying fundamentals. He expresses concerns that excessive optimism driven by the feedback loop could lead to a market surge, typically followed by a downturn. Analyzing long-term earnings growth (LTEG) data for S&P 500 companies, Yardeni and his team find that analysts tend to be overly optimistic about the future earnings prospects of the companies they cover. Historical LTEG peaks, such as those during the late 1990s tech bubble and after the 2018 corporate tax rate cut, serve as cautionary examples. Yardeni also examines LTEG for the MegaCap 8 stocks, including Alphabet, Amazon, Apple, Meta, Microsoft, Netflix, Nvidia, and Tesla. These stocks, representing a significant portion of the S&P 500’s market capitalization, have recently seen substantial LTEG increases, particularly Nvidia. The latest data show Nvidia’s LTEG soaring from 21.2% to 102.5%, significantly contributing to the overall MegaCap 8 LTEG increase, which settled at 38.5% in the latest available figures.

Market News

Goldman Sachs Raises S&P 500 Target to 5,200: Big Tech Takes the Lead

Goldman Sachs has raised its year-end S&P 500 target to 5,200 ahead of Nvidia Corp.’s pivotal earnings this week. The forecast largely relies on the sustained profitability of Big Tech. According to David Kostin, chief U.S. equity strategist at Goldman Sachs, the upgraded 2024 EPS forecast of $241 (8% growth) exceeds the median top-down strategist forecast of $235 (6% growth). This reflects expectations for robust economic growth and increased profits in the Information Technology and Communication Services sectors, which encompass five of the ‘Magnificent 7’ stocks. Goldman Sachs aligns with other optimistic forecasters like Oppenheimer’s John Stoltzfus and Fundstrat’s Tom Lee, who also anticipate a 5,200 finish for the S&P 500. This follows Goldman’s previous adjustment from 4,700 to 5,100 in late December, alongside similar moves from RBC Capital and UBS earlier this year. The upbeat economic forecast stems from Goldman’s economists revising their 2024 real U.S. GDP growth forecast to 2.4%, fueled by robust consumer spending and residential investment. However, the bank emphasizes that the outlook heavily depends on the performance of Big Tech. Analysts highlight Nvidia’s upcoming earnings as a significant market event, with expectations for over a 700% surge in earnings per share compared to the same quarter last year. The company’s performance is seen as pivotal for overall market sentiment. Goldman Sachs anticipates that the Information Technology and Communications Services sectors, which include five of the Magnificent 7 (Meta, Microsoft, Apple, Alphabet, and Nvidia), will lead in earnings growth within the S&P 500 this year, while the rest of the index may see more modest improvements. The bank notes that the strength of Big Tech has also influenced upward revisions in earnings estimates among its peers, with Magnificent 7 earnings estimates and margins forecasts surpassing those of other stocks. While Goldman Sachs acknowledges potential upside risks from stronger-than-expected U.S. growth or positive surprises from major companies, it also warns of downside risks from disappointing macroeconomic growth or underperformance from key stocks. Additionally, any acceleration in input cost inflation could dampen the outlook for profit margins and overall corporate earnings growth.

Scroll to Top