UBS Warns CTA Positioning Could Intensify Market Drop
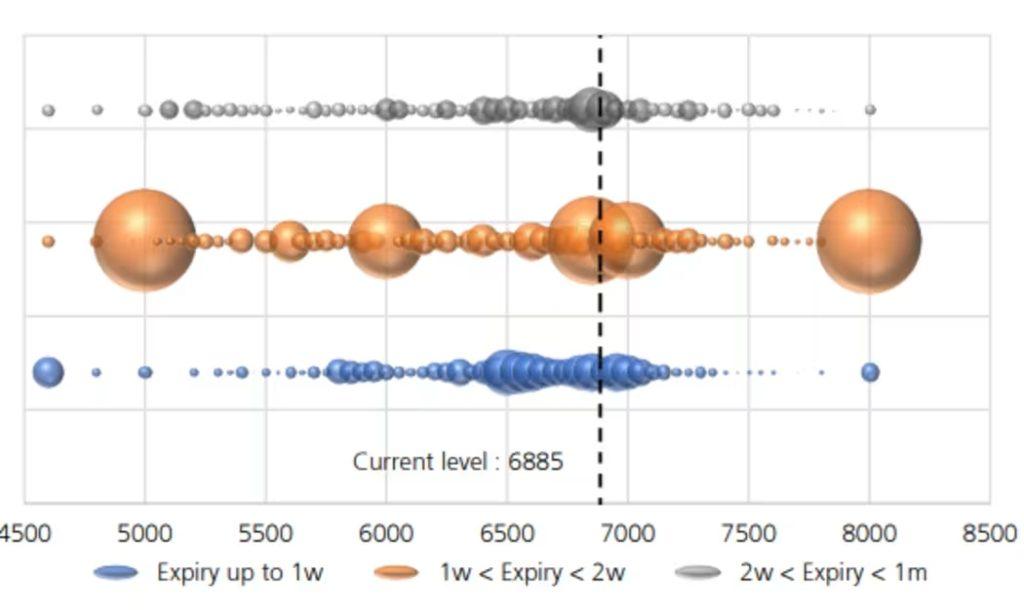
UBS warns that CTA positioning could sharply amplify any market downturn. With a major U.S. options expiration approaching on Dec. 19, markets are heading into a dense cluster of risk events — the Fed decision on Wednesday, nonfarm payrolls on Dec. 16, and the CPI report on Dec. 18. UBS analysts say that given current positioning and the size of outstanding options, even a small pullback could morph into a much steeper decline. Their analysis shows that a drop in the S&P 500 to around 6,500 — about 5% below current levels — could trigger a critical downside inflection point. UBS’s proprietary model, built to track macro hedge fund behavior around expiration, highlights major sensitivity near 6,850. If the index weakens toward 6,500, commodity trading advisors (CTAs), who follow momentum-driven, algorithmic strategies, would be forced to sell into the decline, accelerating the move lower. The Dec. 19 expiration carries unusually heavy risk, with large open interest at the 5,000, 6,000, 6,850, and 8,000 S&P 500 strikes. Because CTAs rely on systematic trend-following and delta hedging intensifies into expiry, their positioning can significantly exaggerate market swings. December’s expiry is even more consequential because it caps both the quarter and the year. UBS finds CTAs have recently added risk but remain skewed toward selling. A slide toward 6,500 would likely force them to unload increasing amounts of futures to manage directional exposure. In Europe, CTAs are very long Eurostoxx 50 near 5,700, and a move toward 5,600 could trigger heavier selling. UBS also highlights other areas of sensitivity: CTAs are near max short the Japanese yen ahead of the Dec. 19 BOJ meeting, heavily long the Chinese yuan, and holding notable long positions in U.S. 10-year Treasurys that could come under pressure if yields rebound toward 4.25%.