S&P 500 Hits 20th Record — What’s Next for Markets?
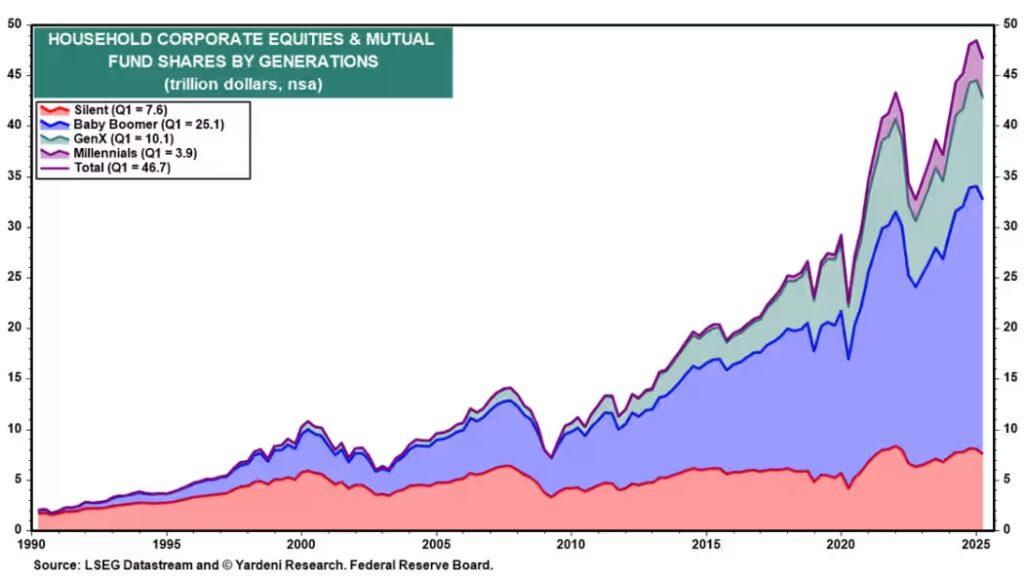
Ed Yardeni: Wealth Effect Will Fuel Even More Growth The S&P 500 just logged its 20th record close of the year, rising 0.32%. Nvidia’s earnings were digested without much drama, effectively wrapping up a supportive second-quarter earnings season. Markets are also leaning on hopes for easier monetary policy. Ahead of Friday’s PCE inflation release, futures are pricing in an 85% chance the Federal Reserve will cut rates by 25 basis points in September. Ed Yardeni of Yardeni Research argues that cheaper borrowing costs will push stocks higher as valuation multiples expand — but warns the Fed risks stimulating an economy that doesn’t really need it. He points to several indicators backing that view: Yardeni notes many firms are still absorbing costs through productivity gains, but more may soon pass them to consumers. The bigger story, however, is the wealth effect. With stocks at record highs, Americans are richer — and that’s boosting spending. Gallup data show 62% of Americans owned stocks at the end of 2024, the highest since 2008. U.S. households held $46.7 trillion in equities and mutual funds in Q1, with baby boomers controlling 54% of it. With a combined net worth exceeding $82 trillion, they’re set to spend and pass down unprecedented wealth. “The bull market is having a significant positive wealth effect on consumers who own equities, more than offsetting the drag from rising credit delinquencies,” Yardeni says. And as the market climbs, so does consumer wealth — continuing to fuel growth in an economy that arguably doesn’t need the extra boost.