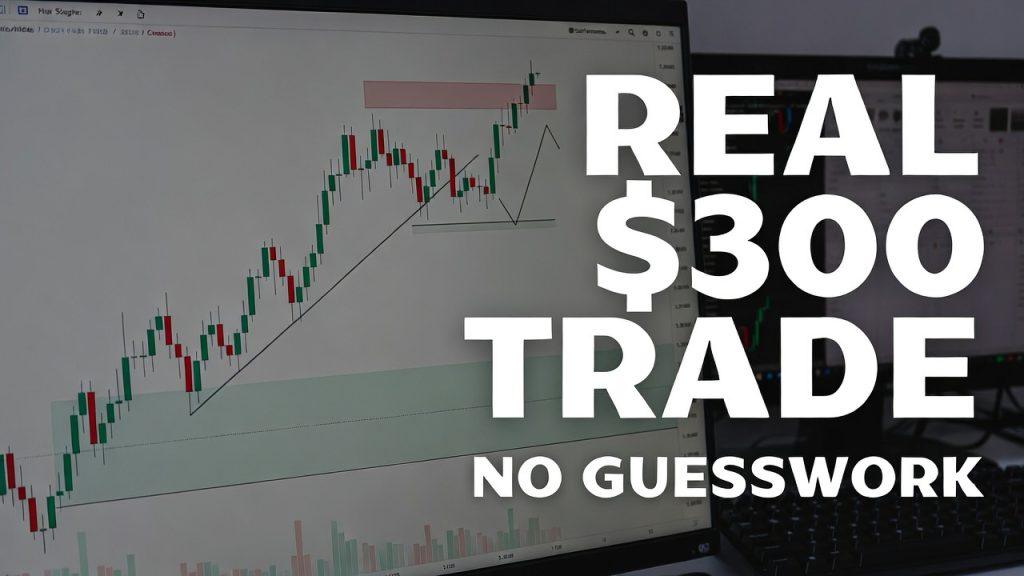
S&P 500
Futures Trading

S&P 500 Volatility: Key Levels to Monitor

S&P 500 Approaches Key Levels: Investors Should Watch 6,700 The S&P 500 is nearing the 7,000 mark amid rising volatility, but the overall trend remains bullish. From a technical standpoint, resistance sits at the all-time high of 6,985, while critical support is at 6,720 — the December low. History shows that breaking December lows in the first quarter often signals the start of a bear market. For example: Currently, there is no volatility band signal, though the +4σ “modified Bollinger Band” remains a potential upside target near 7,100. Sentiment is improving. Equity-only put-call ratios have flipped back to buy signals following heavy call buying off the Jan. 20 lows. Both the weighted and standard ratios now signal bullish sentiment, confirmed by our quantitative models. Market breadth is also supportive. Weak sessions on Jan. 16 and Jan. 20 were offset by a strong rebound on Jan. 21, keeping mid-January breadth buy signals intact. Cumulative volume breadth hit new all-time highs as recently as Jan. 16, confirming the market’s ability to reach new highs. NYSE new highs continue to outnumber new lows, even on down days. On Jan. 21, new highs totaled roughly 250, a clear bullish indicator. Volatility has been the main source of technical uncertainty. The VIX climbed after the Jan. 20 tariff news, briefly flattening the term structure and raising caution. However, the VIX soon retreated, generating a “spike peak” buy signal for stocks. Longer-term VIX signals remain bullish, as the index never closed above its 200-day moving average for two consecutive days. The structure of VIX futures also remains positive. The upward slope of the term structure suggests continued bullish momentum, and February futures — now the front month — remain below March futures. Any sustained inversion would be a warning, but the market currently remains healthy. In summary, the recent tariff-driven sell-off primarily shook out nervous holders, showing that selling could accelerate if a major negative catalyst emerges. However, as long as the S&P 500 holds above last December’s low of 6,720, bulls remain in control. Traders should continue monitoring key levels and use new signals to guide positions, including rolling deeply in-the-money options.

autopilot
DayTradeToWin Review

AutoPilot System: Stops, Targets & Risk Control

What if your trading system could enter, manage, and exit trades for you — automatically? No emotional decisions.No overtrading.No staring at charts all day. In a live market session, our Autopilot Trading System did exactly that — hitting a $500 daily profit target trading just one E-mini S&P contract, then shutting itself off for the day. Here’s exactly how it works — and why this approach is changing how our traders operate. What Is the Autopilot Trading System? The Autopilot Trading System is a fully automated futures trading solution designed for: Once activated, the system automatically: It trades 100% rules-based and emotion-free. A Live Example: $500 and Done In this live session: The system: No overtrading. No second-guessing. No stress. Why This System Works So Well Fully Automated Execution The Autopilot: If the market moves up, it looks for buys.If the market moves down, it looks for sells. Built-In Risk Control You control: This prevents the most common trader mistake: Making money early — then giving it all back later. Once your goal is reached, the system closes all trades and shuts down automatically. Customizable for Any Trader Whether you are: The system can be tuned to match your style. We even provide optimized presets for: Start With Micros (Strongly Recommended) New traders should start with Micro contracts: Then scale up as confidence and consistency grow. Why Automation Beats Emotional Trading Humans: The Autopilot: That’s how real consistency is built. How To Get the Autopilot Trading System The Autopilot Trading System is included with: ✅ Accelerated Mentorship (Monthly or Lifetime)✅ Full access to all proprietary software✅ Sonic System✅ ABC Software✅ Professional training and support Start Free Today Create a FREE member account and get access to: We focus on price action, not lagging indicators. Final Thoughts In one short live session: That’s how modern trading should work: Structured. Disciplined. Automated. 👉 Get Started Now

market
Market News

Market Timers Make a Mistake

Investors’ Rush for the Exits After Tuesday’s Slide Isn’t How Bull Markets End Tuesday’s sharp stock-market selloff likely did not signal the end of the bull run — and the behavior of market timers suggests why. History shows that major market tops are usually marked by complacency, not fear. Investors tend to dismiss declines and treat them as buying opportunities. That wasn’t the case this week. Short-term market timers reacted swiftly to Tuesday’s drop, slashing equity exposure by nearly 20 percentage points, according to the Hulbert Stock Newsletter Sentiment Index (HSNSI). That ranks among the steepest one-day declines in the index since data collection began in 2000. This reaction looks nothing like what happened at the peak of the dot-com bubble. After the Nasdaq topped out on March 10, 2000, the index fell more than 10% over the next two weeks. Yet instead of pulling back, the HSNSI actually rose by 2.5 percentage points, showing that investors were still eager to buy the dip. The contrast is striking. This week’s market drop was far smaller than the one in 2000, yet investors responded with far more caution, not optimism. From a contrarian standpoint, true market tops tend to form when investors remain convinced that every pullback is an opportunity. Further insight comes from Yale professor Robert Shiller’s “Buy-on-Dips Confidence Index,” which tracks how many retail investors expect the market to rise after sharp declines. Historically, the S&P 500 has delivered weaker returns following periods of high dip-buying confidence than when such confidence is low. Although Shiller’s index is released with a delay, the sharp fall in the HSNSI suggests dip-buying enthusiasm has cooled considerably. This doesn’t mean risks have disappeared. Valuations remain stretched, and the bull market may be in its later innings. But if the market follows historical patterns, the eventual top will be met with denial and complacency — not the kind of fear-driven retreat seen after Tuesday’s selloff. Put simply, panic is usually not how bull markets end.

market
Market News

Global Market Slides, but History Says Buy the Dip

Market Sell-Off From Greenland Crisis May Be a Buying Opportunity, HSBC Says Major geopolitical shocks over the past 25 years have repeatedly turned into buying opportunities — and according to HSBC, the current market turmoil sparked by the Greenland crisis is likely to follow the same pattern. The latest escalation in geopolitical tensions and the renewed threat of tariffs triggered a broad-based sell-off across global markets, hitting a rare trifecta: U.S. stocks, bonds, and the dollar all declined at the same time. On Tuesday, the S&P 500 fell 2.1%, while the U.S. 10-year Treasury yield jumped six basis points to around 4.29%. Meanwhile, the U.S. dollar weakened against the euro, British pound, and Canadian dollar. Investors rushed toward traditional safe havens, lifting gold and the Swiss franc sharply. Despite the turbulence, HSBC chief multi-asset strategist Max Kettner says history suggests investors should stay calm. In a note released Tuesday, Kettner pointed out that roughly 75% of geopolitical and macro crises over the past 25 years have ultimately been “faded” by markets — meaning the initial panic selling eventually gives way to recovery. He cited recent examples, including the 2025 market sell-off following President Donald Trump’s “Liberation Day” tariff announcement and the Israeli strikes on Iran, as evidence that looking past short-term volatility has consistently rewarded long-term investors. Kettner expects a similar pattern this time, with tough opening rhetoric eventually softening into negotiations and compromise. Still, HSBC is not ignoring the risks. Kettner warned that U.S. interest rates and risk assets are approaching a “danger zone.” He identified 4.4% on the U.S. 10-year yield and 5% on the 30-year bond as critical technical levels. A sustained break above those levels could trigger a deeper and more prolonged market downturn. For now, however, Kettner believes the U.S. economy remains in a “Goldilocks” environment, with growth, employment, and inflation balanced well enough to keep the Federal Reserve on a dovish path. That backdrop should prevent a major repricing of expectations for two interest rate cuts in 2026. He also noted that the VIX volatility index futures curve is in backwardation — a technical signal that markets may already be oversold. On top of that, with fourth-quarter earnings expectations set relatively low, companies could find it easier to beat forecasts, potentially providing another boost to stock market sentiment. Bottom Line: Is This Market Dip a Buying Opportunity? HSBC’s conclusion is clear: while geopolitical headlines are driving short-term volatility, history suggests this sell-off is more likely to become another buying opportunity rather than the start of a sustained bear market. For traders and investors, the message is simple — don’t confuse short-term fear with long-term fundamentals.

citi
Market News

Citi Turns Neutral on Europe as Trade Fears Return

Citi Downgrades European Stocks to Neutral as Tariff Risks Threaten Earnings Recovery Citi has downgraded European equities to neutral, warning that rising trade tensions between the U.S. and Europe are clouding the outlook for corporate earnings and undermining hopes for a sustained profit recovery. The move marks the first time in more than a year that the bank has turned cautious on the region’s stock markets. Strategists said uncertainty surrounding U.S. trade policy — particularly renewed tensions linked to Greenland — has increased downside risks to earnings forecasts across corporate Europe. In a note published Monday, Citi’s European equity strategist Beatha Manthey said the threat of new U.S. tariffs has widened the risk to earnings per share expectations. U.S. President Donald Trump has warned he could impose a 10% tariff on imports from eight major European economies, with the rate rising to 25% by June 1 if his demands are not met. The European Union, in response, is considering a €93 billion ($109 billion) package of retaliatory measures targeting selected U.S. goods and services, raising the risk of a renewed transatlantic trade war. Before the latest escalation, analysts were forecasting around 10% earnings growth for European companies, driven largely by trade-sensitive sectors such as autos, technology and consumer goods. Last year, earnings grew just 1%, weighed down by earlier tariff disputes and a stronger euro. The setback comes at a delicate time for European markets. Similar expectations for a rebound in 2025 failed to materialize, when earnings growth was also expected to reach 10% but ended the year flat, reviving fears of another false dawn. Citi now expects European earnings to grow by just 8% in 2026 and says risks remain skewed to the downside given the unpredictability of U.S. trade policy. Manthey noted that every 10% rise in the euro against the dollar typically reduces European earnings forecasts by about 2%. That leaves the Stoxx Europe 600 particularly exposed. Citi estimates that the 30% of companies in the index with the greatest international exposure account for roughly 45% of its market value. The bank now sees only about 5% upside for the Stoxx 600 by year-end. Alongside the broader downgrade, Citi cut the autos and chemicals sectors to sell, while upgrading energy to neutral. European shares remained under pressure, with the Stoxx 600 down about 1.3% on Tuesday after falling by a similar amount the previous day. U.S. stock futures also weakened after a three-day market break.

sonic
DayTradeToWin Review

Sonic Trading Strategy: How to Profit in Slow Markets

Even in a slow, half-day holiday session, disciplined price action trading continues to deliver results. On Monday’s shortened trading day, the Sonic System generated six trade signals, producing five completed winning trades before the market closed early for the federal holiday. With liquidity reduced and volatility muted, the session provided a textbook example of how professional traders adapt strategy and timeframe to changing market conditions — and why structure-based systems outperform indicator-driven approaches. Trading a Holiday Session: Why Timeframe Matters Holiday sessions are known for: To adjust, traders using the Sonic System shifted to a 5-minute chart rather than the 1-minute chart typically used in higher-volatility conditions. The longer timeframe allows price more room to develop and creates more realistic profit targets when the market is moving slowly. Despite the quiet conditions, the system delivered: Market Structure: Why a Gap Fill Is Likely Comparing Friday’s close to Monday’s open reveals a clear price gap. From a technical perspective: The current structure suggests the market may attempt to fill the gap as early as Tuesday or Wednesday. As a result, the trading plan remains focused on long opportunities, guided by the Sonic System, Atlas Line, and Roadmap tools. Why the Sonic System Performs in All Market Conditions Whether markets are: The Sonic System is built around: This allows traders to stay synchronized with the market rather than reacting to lagging indicators. Part of the DayTradeToWin Professional Trading Suite The Sonic System integrates with the full DayTradeToWin ecosystem, including: Together, these tools help traders: Learning the Professional Approach Traders looking to move beyond indicator-based strategies can now access the Accelerated Mentorship Program, which includes: New traders can also start with a free member account at daytradetowin.com, which includes trial access to select tools, including the ABC software. Outlook Monday’s session reinforced a simple principle: Even in low-volume markets, structure and discipline create opportunity. With the market showing a bullish structure and a gap likely to be filled, attention now turns to the next sessions, where the Sonic System will continue to guide trade decisions through price action and market structure.

Scroll to Top