ES Futures Short Setup: Multi-Indicator Resistance Reversal Explained
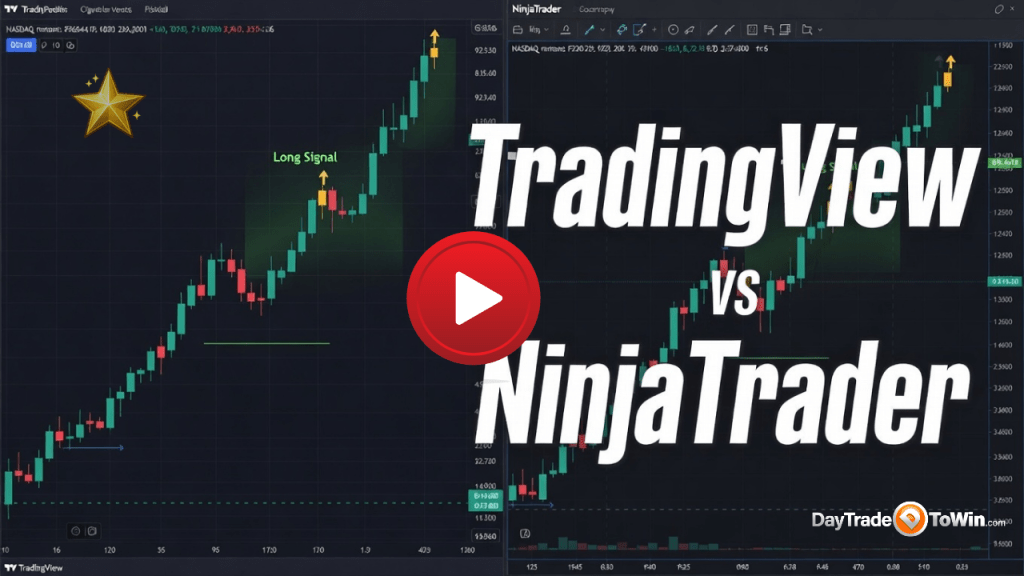
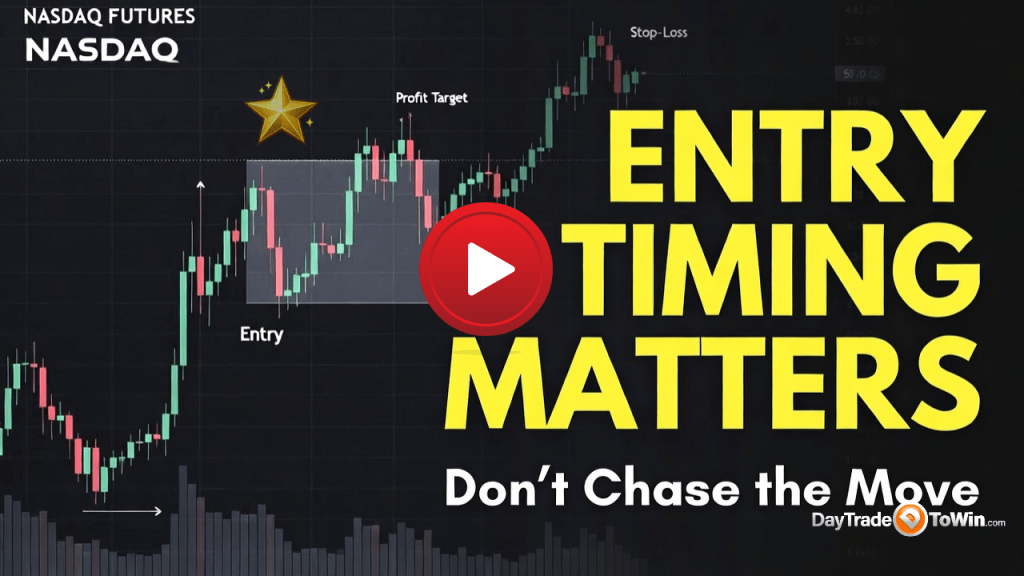
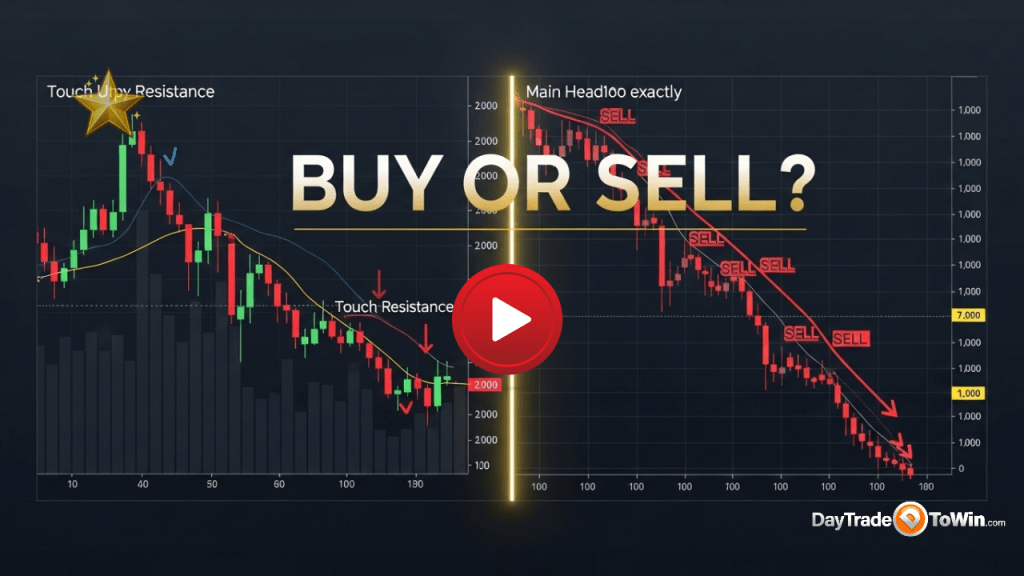
In this recent live session, the ES futures market approached a widely watched resistance zone and quickly revealed signs of exhaustion. Rather than continuing higher, price behavior shifted as several proprietary tools began to align to the bearish side. For traders who rely on structured decision-making, this type of multi-indicator agreement can provide valuable directional context. In this review, we’ll break down what developed near resistance and how traders can use confirmation-based workflows to improve trade selection. 📊 Understanding the Importance of Major Price Levels Large round numbers often attract increased attention from active futures traders. These zones frequently act as decision points where momentum either accelerates or fades. As price moved into this upper boundary, several subtle warning signs began to appear: Although the session initially opened with upward pressure, the market’s response near resistance suggested weakening buying interest. ⚠️ Bearish Confirmation Across Multiple Tools Professional traders rarely rely on a single signal. Instead, they look for confirmation stacking — when independent tools point toward the same directional bias. During this setup, multiple DayTradeToWin components began to align to the short side, including: When this level of agreement appears simultaneously, it can help traders develop greater confidence in the prevailing bias. 📏 Why Volatility Context Matters (ATR) The Average True Range (ATR), configured to 4 in this example, provided important insight into current market conditions. While ATR does not predict direction on its own, it helps traders better understand: Most major platforms — including TradingView and NinjaTrader — include ATR by default. However, its usefulness increases significantly when combined with structured price-action tools. 🎯 Execution and Trade Management Considerations As highlighted in the session, proper trade management remains just as important as signal quality. Experienced intraday traders typically focus on principles such as: In fast-moving futures environments, many intraday setups tend to complete within a relatively short window, making execution discipline essential. 🧩 Application for Funded and Prop Firm Traders For traders operating in funded accounts or evaluation programs, quickly identifying market bias can be especially important. Platforms like NinjaTrader and TradingView provide the execution framework, while structured analytical tools help standardize the decision process. Within the DayTradeToWin ecosystem, traders often utilize combinations of: These tools are designed to help traders apply rule-based workflows rather than emotional decision-making. 🚀 Explore the DayTradeToWin Ecosystem If you want to study structured price-action workflows and confirmation-based trading: 👉 https://daytradetowin.com Free member access includes educational resources and platform integration guidance. 🧠 About DayTradeToWin DayTradeToWin is a trading education and software provider focused on helping traders interpret price behavior, understand market structure, and apply disciplined execution techniques in the futures markets. The company develops proprietary analytical tools and structured training designed to support objective, rule-based decision-making on platforms such as NinjaTrader and TradingView. DayTradeToWin resources are used by independent traders, funded account participants, and proprietary trading firm candidates seeking a systematic approach to intraday futures trading. 🎓 Educational Focus DayTradeToWin training emphasizes: The objective is to help traders reduce emotional bias and implement repeatable processes. 🖥️ Platform Compatibility DayTradeToWin tools integrate with widely used professional trading platforms, including: Available proprietary tools include: These tools are designed to assist traders in identifying potential opportunities using structured rule sets.