S&P 500
Market News

S&P 500 Stalling? Turn to Oversold Stocks Instead

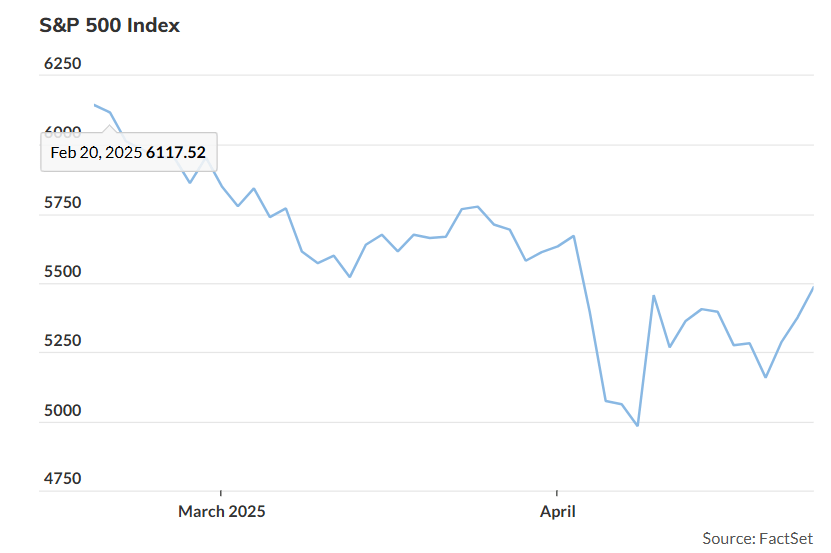
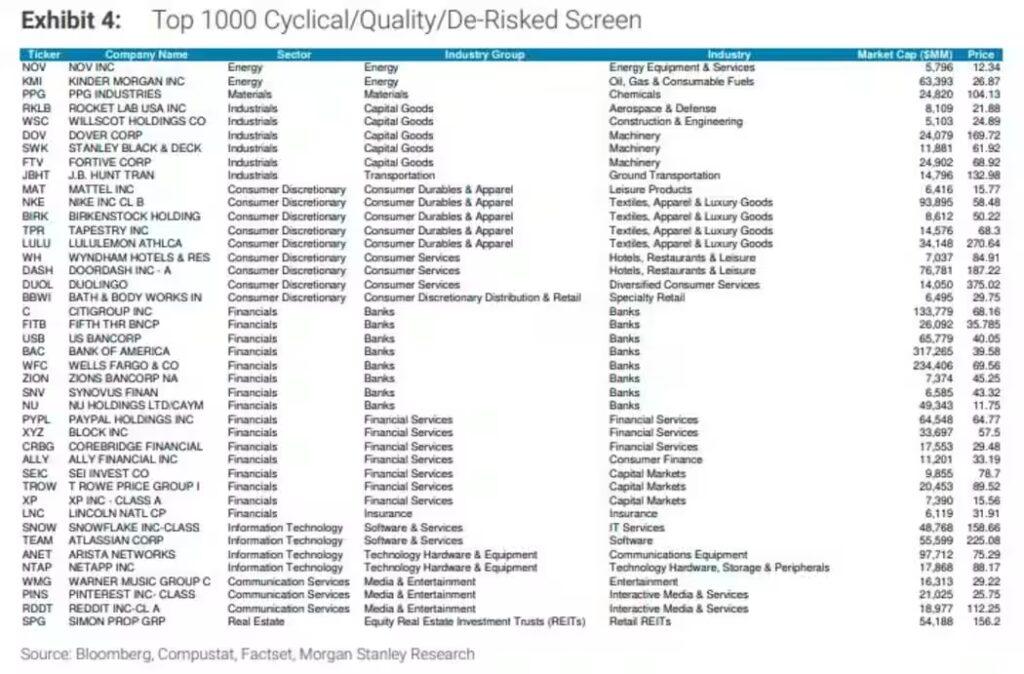
Morgan Stanley: Stick with High-Quality Cyclical Stocks as Market Remains Rangebound As the S&P 500 continues to trade sideways, Morgan Stanley strategists are advising investors to focus on high-quality cyclical stocks that have already priced in a potential slowdown in both earnings and economic growth. Led by Mike Wilson, the team at Morgan Stanley notes that the S&P 500 remains trapped between 5,000 and 5,500. While they see the next resistance between 5,600 and 5,650, they don’t expect a meaningful breakout until several catalysts materialize: a significant U.S.-China tariff reduction (currently at 145%), clear signs of Fed interest-rate cuts, a drop in the 10-year Treasury yield below 4.0%, and a strong rebound in corporate earnings revisions. Markets are facing a critical week of data releases. Wilson and his team point to Friday’s nonfarm payrolls report and Thursday’s ISM manufacturing survey as key events. A swing in ISM data — expected between 46 and 48 — could significantly move stocks. While some slowdown has been priced into equities, the risk of a broader labor market downturn or mild recession has not, they warned. Sustained stability in labor data over several months would be needed to ease those concerns. In the meantime, Morgan Stanley recommends a balanced approach: maintaining defensive exposure while selectively adding to high-quality cyclical stocks that have already adjusted to weaker conditions. Their definition of “quality” includes companies with strong management teams, consistently high returns, and healthy balance sheets. “Cyclicals” are companies whose earnings closely track economic growth. To help guide investors, the strategists screened the top 1000 U.S. stocks by market capitalization, focusing on those rated overweight or equal weight by Morgan Stanley, considered cyclical, and deemed less risky based on several valuation and performance metrics. The top five stocks from their screen are: Other notable mentions include Mattel, Nike, and several bank stocks. Overall, Wilson and his team prefer U.S. equities to international ones, citing a weaker dollar that should support U.S. earnings more than those in Europe or Japan. With earnings less volatile and a bias toward higher quality, they see the U.S. market as better positioned in today’s late-cycle environment.

sonic
Market News

Today’s Winning Trade Recap: Sonic System

Today we’re continuing our journey with the powerful Sonic Trading System. As always, a quick reminder: trading involves risk. Only trade with money you can afford to lose. If you’re a member of Day Trade to Win, make sure to join our live trading room where we showcase real-time signals and much more! 📈 Live Signal: Long Opportunity Today, we received a live long signal at 5474.25. Here’s the setup: The Sonic system does the heavy lifting by automatically placing stops and targets. All you need to do is follow the signals.We recommend using a limit order to avoid slippage, but market-if-touched or even market entries can also work depending on your style. A little patience today could have even snagged a better price! 📊 Trading Approach: Keep It Simple For today’s trades, I’m using a 1-minute E-mini S&P chart.The Sonic system also performs great on: Pro Tip:If you’re just starting, trade the Micro E-mini first. It’s a smart way to get comfortable before moving into bigger markets. The Sonic system is available on both NinjaTrader and TradingView platforms. Plus, every user gets access to live training sessions, where we dive deep into settings, entry techniques, and strategies for best results. 📈 How Many Trades Should You Take? Success isn’t just about spotting signals — it’s about knowing when to stop. ✅ We typically aim for 5–6 trades per day.✅ Today, we’ve already seen five or six consecutive winners! Quick Tip:If you spot one or two winning trades in a row, it often signals strong momentum. That’s your green light to enter smartly. I also prefer to keep trades quick—about 10 to 15 minutes—depending on the market conditions. 🚀 Take Your Trading to the Next Level Not a member yet? Now’s the perfect time!Create your free account at DayTradeToWin.com and unlock: Skip the outdated indicators. Learn to trade the right way—with pure price action.Let’s get you ready for success in our next training session! Until then, Good Trading!

trade
DayTradeToWin Review

Trade Smarter, Avoid Fakeouts

If you’re planning to sell the market, timing is critical. It’s easy to get caught up in the moment and jump in too early — only to see the market bounce right back against you. That’s why today, I’m going to show you a smarter way to trade short, using powerful tools like the Trade Scalper and Roadmap Software from DayTradeToWin. Selling Smart: Follow the Market to the Zone When you’re looking to go short, you don’t want to sell just anywhere. Instead, let the market guide you down to the zone. As the market moves lower toward the zone, that’s your setup. But once it touches the zone, pause — don’t sell immediately. Wait for a clear break through the zone before acting. Why? Because these zones often act like hidden walls of support, causing price to reverse sharply. Here’s a quick example: A Trade Scalper short signal triggered. We entered as the market dropped toward the zone. Our target? The zone itself. Once it hit, the market bounced — just as expected. By exiting at the zone, we avoided the reversal and locked in profits. Understand Market Manipulation — And Use It to Your Advantage The Roadmap Software shows you in advance where manipulation zones are likely to form — long before price gets there. Think of these zones as spots where big traders are building and unloading positions. When price hits these areas, they take profits, often causing sudden reversals. If you know where these zones are, you can: Trading becomes less about guessing and more about following the footprints of big money. Combining the Trade Scalper with the Roadmap for Better Trades The Trade Scalper gives precise entry signals. When you combine it with the Roadmap zones, you add a powerful layer of protection. Here’s how: If a scalper signal appears, check if a zone is nearby. If so, wait for a clean breakout before entering. If the path is clear, you’re good to go. This small adjustment can make a big difference in your win rate. For instance, on a 30-condensed chart, we watched the market hit a zone, bounce hard, and then reverse. The Roadmap predicted it, helping traders avoid bad shorts and capture better entries. Quick Tips for Shorting Like a Pro ✅ Sell as the market moves down to the zone, but exit at the zone.✅ Wait for clear breakouts before shorting beyond a zone.✅ Stack your signals — combine Trade Scalper, Roadmap, and more for extra confirmation.✅ Skip the clutter — trade price action, not indicators. Ready to Trade Smarter? At DayTradeToWin, we help traders cut through the noise. No complicated indicators. No guessing. Just clean, price-action trading based on proven methods. Want to get started? Open a free member account at daytradetowin.com and access trial versions of our most popular software. Or jump straight into our Accelerated Mentorship Program to get everything you need to trade like a pro. The market isn’t random — it’s predictable if you know what to look for.Learn the patterns. Follow the plan. Win more trades.

S&P 500
Market News

Trump Reversals Spark S&P 500 Rebound

What It Will Take for the S&P 500 to Reclaim Record Highs—and for Other Indexes to Recover Wall Street isn’t known for subtle reactions, and the recent market swings are a case in point. The S&P 500 rallied sharply on Thursday, officially climbing out of correction territory by closing more than 10% above its April 8 low—reached shortly after President Trump’s April 2 tariff announcement, which rattled global markets. That low marked the bottom of a sharp selloff driven by renewed trade tensions and fears of economic fallout. A key turning point came when the Trump administration paused new tariffs for most countries (excluding China), calming market nerves. From that April low to Thursday’s close, the S&P 500 recovered an eye-popping $4.253 trillion in market value, according to Dow Jones Market Data. Still, the index remains 10.7% below its February record high, and broader uncertainty continues to hang over the markets. Jamie Cox, managing partner at Harris Financial Group, attributed much of the volatility to the surge and subsequent decline in the Cboe Volatility Index (VIX)—Wall Street’s “fear gauge”—which soared above 50 during the worst of the selloff but has since retreated to around 20. “When volatility unwinds, stocks tend to rebound just as dramatically,” he noted. Adding to the bullish momentum was Trump’s recent softening tone toward Federal Reserve Chair Jerome Powell, saying he doesn’t plan to remove him before his term ends in 2026. That reassurance helped settle investor jitters about central bank independence. Pimco’s Libby Cantrill and Tiffany Wilding cautioned in a client note that firing Powell could actually hinder Trump’s goal of lower interest rates. Markets seemed to agree, as the 10-year Treasury yield fell six basis points Thursday to 4.32%, following its largest weekly move since 1987 just two weeks ago. “The Fed’s direction weighs heavily on markets,” said Cox. “Removing uncertainty around Powell is a big stabilizing factor.” Looking ahead, Cox said that progress on trade deals and a cooling of Fed tensions could help push stocks back toward record highs. With Congress returning next week, a breakthrough on budget negotiations and the debt ceiling could further lift investor confidence. Still, much hinges on how the global trade landscape evolves. Cox expects negotiations with China to drag on, while deals with Europe and others may come together more quickly. Where the major indexes stand now:

sonic
DayTradeToWin Review

Sonic System: Clean Trade, No Indicators

Today, I want to walk you through a quick, live trade using the Sonic System on the Micro E-Mini S&P (MES). This trade highlights just how efficient and powerful price action strategies can be when applied with precision and confidence. 🛠 The Setup: Spotting Opportunity in Real Time Right after wrapping up a video covering setups on Crude Oil, NASDAQ, Bitcoin, and the E-Mini, I spotted a clean entry on the MES. I hit record and executed a long trade live. Key details: This trade had the right setup and momentum. I liked the balance of risk and reward, and more importantly—I wanted to show how quickly you can act when your system gives you a green light. 🧩 Duplicating the Trade on the ES To show how adaptable the Sonic System is, I entered the exact same trade on the full-size E-Mini S&P (ES). Whether you’re trading micros or full contracts, the strategy applies seamlessly. Some traders prefer the MNQ (Micro NASDAQ) or the MES for smaller sizing, but the core idea stays the same: structure your trades with precision and keep your risk under control. 🎯 Target Hit, Now What? On the MES, the price quickly hit the profit target—perfect. Meanwhile, the ES trade was still active, so I adjusted my stop and target levels using the chart trader tool. This is something I always emphasize:👉 Adjust your trade dynamically. Don’t “set and forget” unless you have a very specific reason. If price stalls or lingers below your entry for too long, that’s a warning sign. A trade should move in your favor shortly after entry—if not, it might be best to get out and reassess. ❌ The Biggest Mistake: Holding Losers Too Long Many traders hesitate to close a trade that’s not working out, hoping it will turn around. This can be a costly habit. Here’s the truth:✅ Taking a small loss or exiting at break-even is completely fine.🚫 Holding a bad trade and moving your stop? That’s what gets traders in trouble. Don’t be afraid to cut a trade early if it’s not playing out as expected. Discipline will save your account—hope will not. 📉 Slippage Tip: Move the Limit, Not the Stop If you want to exit a trade quickly but cleanly, avoid unnecessary slippage: It’s all about managing risk and execution. Don’t leave it up to luck. 🧠 Want to Learn the Right Way to Trade? If you’re tired of relying on outdated indicators and want to master true price action, head over to DayTradeToWin.com and sign up for a free member account. You’ll get: Let’s get you trading with clarity and confidence. This is your invitation to trade smarter—not harder.

gold
Market News

Gold Hit Hard: Bull Run Ending?

Gold Suffers Sharpest Drop Since 2021 as Trade Tensions Ease and Fed Uncertainty Fades Gold prices saw their steepest single-day drop in nearly four years on Wednesday, as a shift in U.S. trade policy rhetoric and reduced fears over the Federal Reserve’s leadership deflated the metal’s momentum. After a blistering rally that saw gold top $3,500 an ounce earlier this week, prices tumbled $125.30, or 3.7%, to close at $3,294.10 — the biggest one-day percentage drop since June 2021, according to Dow Jones Market Data. Tuesday’s session had already hinted at weakness, with gold futures pulling back from a record intraday high of $3,509.90 to settle at $3,419.40. The decline followed signs that the White House may ease tariffs on Chinese imports, according to reports, and a softening stance from former President Trump toward Fed Chair Jerome Powell. That double shift eased fears that had fueled gold’s rally and reduced demand for the metal as a safe-haven asset. “Gold’s been riding the trade-war narrative, and that leg just got wobbly,” said Stephen Innes, managing partner at SPI Asset Management. He added that the rally had been driven more by headlines and speculation than fundamentals, and with those headlines cooling, the rally is deflating fast. Jonathan Krinsky of BTIG noted that gold had climbed to more than 27% above its 200-day moving average — a historically extreme level that often signals overbought conditions and a potential “blow-off” top. When that threshold has been reached in the past, gold has typically pulled back toward its average in the following months. Despite the sharp correction, many analysts see this as a healthy pause rather than a definitive peak. “There’s nothing indicating that $3,500 is a hard top,” said Michael Armbruster of Altavest. “We’re still in an uptrend — this looks like a standard correction within a bull market.” Jim Wyckoff of Kitco.com agreed, suggesting the rally may be near the end of its cycle in terms of timing, but not necessarily in price. “Markets often experience larger swings near the end of a bull phase, but gold could still surprise to the upside before it’s over.” Gold had been on a tear since 2022, rising from around $1,600 an ounce on the back of geopolitical turmoil, high inflation, and fears over global economic stability. Even after this week’s drop, the metal remains up significantly, with gains of over 25% year to date. “This correction doesn’t change the underlying bullish thesis,” said Trevor Yates, senior investment analyst at Global X ETFs. “It’s more about investor positioning than any shift in fundamentals.” He noted continued demand from central banks and ongoing economic uncertainty as key supports for gold. With the metal still outperforming equities in 2025 and broader market volatility persisting, analysts suggest the recent dip may offer a strategic entry point for long-term investors

Scroll to Top