stocks
Market News

Why Stick with Stocks Despite ‘Lost Decade’ Warnings

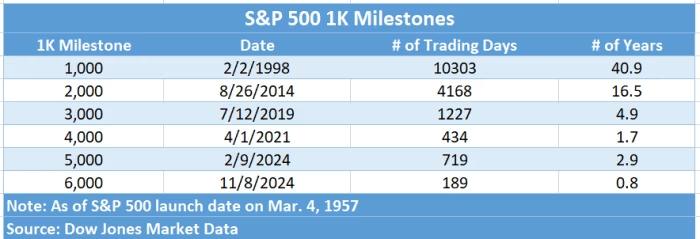
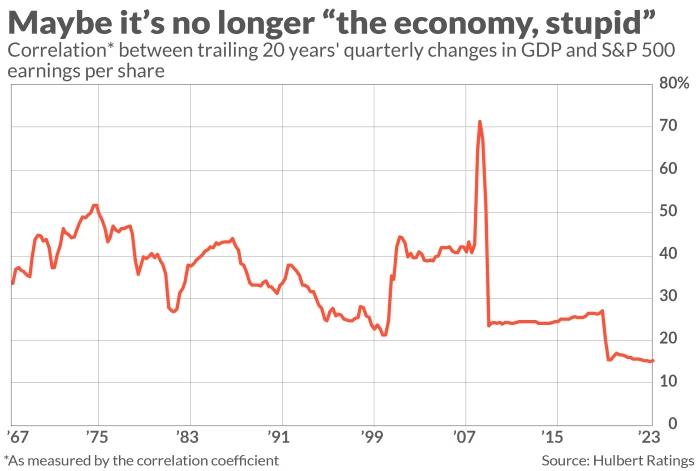
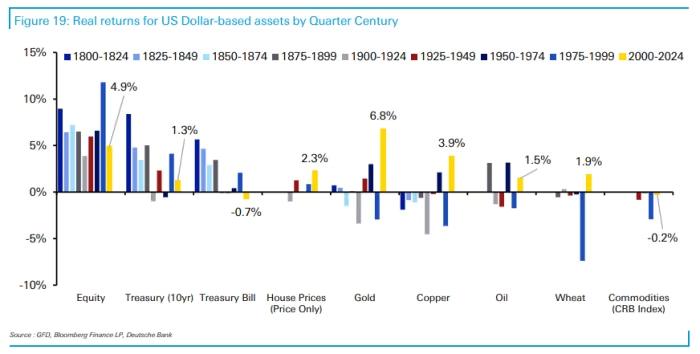
Though stocks have recently enjoyed a strong run, Deutsche Bank strategists have highlighted that stock-market returns over the past 25 years haven’t been as impressive as they might seem. Their recent report notes that, since 2000, global markets have navigated rising debt levels, slower demographic growth, and a slowdown in globalization. For context, in 2000, the U.S. Congressional Budget Office projected that federal debt could be paid off by 2013; instead, the debt-to-GDP ratio has surpassed 100%, a level not seen since just after World War II. From the perspective of stock performance, the S&P 500’s returns since December 31, 1999, tell a story shaped by setbacks, including the dot-com crash, the 2008 financial crisis, and the inflation surge in 2022. These factors have left this 25-year stretch with the second-lowest annualized returns out of nine periods dating back to 1800—only the early 20th century fared worse. This serves as a reality check for those expecting uninterrupted stock market growth, especially as some analysts, including those at Goldman Sachs and Vanguard, warn of single-digit returns in the years ahead. Adding to this perspective, Deutsche Bank’s analysis shows that stocks haven’t just delivered lower returns in absolute terms; they’ve also lagged behind other assets like gold. Since 1999, gold has achieved annualized returns of 6.8%, surpassing the S&P 500’s 4.9%. Even in 2024, gold slightly outperformed stocks, with a year-to-date gain of 25.6%. Despite these challenges, Deutsche Bank maintains that equities remain a solid choice for long-term investors. Historically, stock underperformance doesn’t tend to last more than a decade, and with global debt rising, there’s an increased likelihood of future inflation. In such periods, stocks have historically outperformed bonds, which suffered significantly in 2022.

sonic trading system
DayTradeToWin Review

Sonic Trading System: Real-Time Strategies for Success

Today, we’re going to examine the Sonic Trading System in action. With multiple signals already flashing this morning, this live breakdown will help you understand the precision and flexibility of Sonic – whether you’re trading for a prop firm or managing your own account. Let’s dive into today’s setups and what makes the Sonic system a powerful tool for price-action traders. Introduction to the Sonic Trading System The Sonic Trading System is a streamlined approach focused solely on price action, providing clear entries, stops, and targets without relying on traditional indicators like moving averages or stochastics. Traders using this system can enjoy a high win-to-loss ratio when managing trades carefully. Today, I’ll walk you through some live examples to show how Sonic guides trade decisions. Today’s Key Trade Signals and Insights This morning, the Sonic system has already generated several promising signals. Here’s how to approach them: Who Benefits Most from the Sonic System? The Sonic Trading System is particularly suited for traders who: Example Trade Breakdown: A Sonic Short Position In today’s example trade: If a trade isn’t moving favorably within a few minutes, it’s often wise to exit early to preserve capital. Sonic makes it easy to adjust stops and targets on the go, keeping you agile. Avoiding the Trap of Overtrading With so many signals, it’s easy to overtrade. The goal is to trade selectively, aiming for 5-10 high-quality trades per day. This approach not only avoids the risk of burnout but also prevents poor decision-making due to fatigue. Keep it simple and structured; that’s how you make the most of the Sonic system. Get Started with DayTradeToWin’s Free Membership Interested in trying Sonic yourself? DayTradeToWin offers a free membership where you can access introductory tools and resources. Here’s what you’ll get: Conclusion Today’s breakdown showcases the power of the Sonic Trading System for those looking to master price action with a clear, rules-based approach. Remember, trading is risky, and it’s crucial to manage each trade with a steady hand. The Sonic system is ideal for traders who prioritize balanced setups and precise entries. If you’d like more in-depth tutorials, subscribe to DayTradeToWin on YouTube for daily insights. Visit DayTradeToWin.com to join our community, explore the Sonic system, and take your first steps with a free membership. Trade smart, stay disciplined, and enjoy the journey!

S&P 500
Market News

S&P Hits 6,000, Dow Breaks 44,000 — What’s Next?

Tony Roth, Chief Investment Officer at Wilmington Trust, projects that the S&P 500 could climb into the mid-6,000s over the next two months, as recent market optimism shows no signs of slowing. On Monday, the S&P 500 closed above 6,000, while the Dow Jones Industrial Average topped 44,000 for the first time. Both indexes are riding the momentum from last week’s rally following Donald Trump’s presidential victory and a 25 basis point rate cut by the Federal Reserve. Clark Geranen, chief market strategist at CalBay Investments, highlighted the S&P’s 6,000 milestone as “a psychologically significant level” that could draw in more investors still holding cash in money-market funds and bonds. He attributes the market’s recent strength to a combination of easing volatility, boosted by a drop in the VIX, and renewed optimism in the economy. On Monday, the S&P 500 gained 5.81 points, or 0.1%, to close at 6,001.35—marking its first close above 6,000. The Dow rose 0.7% to 44,293.13, reaching another historic milestone. According to Dow Jones Market Data, this marks the quickest 1,000-point climb for the index in its history. Leading this surge were stocks like Vistra Corp., Palantir Technologies Inc., Targa Resources Corp., Nvidia Corp., and United Airlines Holdings Inc. The recent rally gained strength after Trump’s return to the White House and prospects of a Republican-led Congress, with the Fed’s rate cut providing an extra boost. The Nasdaq Composite Index also showed resilience, inching up 0.1% on Monday after a strong week of gains. Yet some analysts urge caution. Paul Christopher, head of global investment strategy at Wells Fargo, warns that while the market has latched onto specific policy hopes, these selective reactions may not guarantee lasting gains. He suggests waiting for a clearer picture of the administration’s main policy directions. Bond markets, closed Monday for the Veterans Day holiday, are also on investors’ minds. The 10-year Treasury yield recently ended at 4.307%, raising concerns over inflation and potential impacts of higher borrowing costs on equities. Roth remains bullish in the near term but notes that once Trump takes office, the market will be looking closely at his plans for lowering taxes without excessively increasing deficits.

Wall Street
Market News

The Wall Street-Main Street Divide in 2024

This year’s strong gains in the Dow Jones suggested an advantage for the Democrats and Kamala Harris in the presidential election, but it underscored an important reality: Wall Street and Main Street are drifting further apart. Historically, the stock market has been viewed as a bellwether for election outcomes, but this election proved otherwise, raising the question of why it failed to predict the results. Over recent months, I tracked a model that connected the incumbent party’s chances of staying in office to the Dow Jones Industrial Average’s performance. Leading up to the election, this model gave Vice President Kamala Harris, the Democratic candidate, a 70% likelihood of defeating former President Donald Trump. When models like this one falter, it’s an opportunity to reassess their assumptions. Is this merely an example of a model’s natural limitations? Or does it reflect fundamental shifts in the economy and markets, diminishing the model’s relevance? In retrospect, the breakdown seems to stem from a widening gap between Wall Street’s performance and the realities of the broader economy—often referred to as the Wall Street-Main Street divide. In the past, the Dow was a fairly reliable indicator of the economy’s health and, by extension, voters’ economic sentiment. But that connection has weakened considerably over the years. To highlight this shift, I examined the long-term relationship between quarterly U.S. GDP growth and S&P 500 earnings per share (EPS) going back to 1947, using a 20-year trailing correlation. This correlation, which reached about 40% in the early 1990s, is now just 15%, showing a steady decline, with the only notable exception being the brief alignment during the 2008-09 financial crisis. This declining correlation sheds light on why this year’s stock market surge didn’t translate into stronger support for Harris. While Wall Street rallied, many Americans are still grappling with financial hardships. The implications are clear: traditional economic indicators may be losing their forecasting power, and analysts may need to focus more on company-specific factors rather than broad economic cycles. Vincent Deluard, StoneX’s director of global macro strategy, recently echoed this sentiment, observing that “investors spend far too much time worrying about the next recession. Economic growth is just one small driver of stock prices. Margins and multiples matter a lot more.” In other words, understanding stock performance today may require focusing on the profitability and valuation multiples of companies rather than macroeconomic indicators. This shift doesn’t simplify forecasting; profit margins and price-to-earnings ratios are challenging to project. However, by recognizing the diminishing role of economic growth in market performance, analysts can refocus on these crucial factors driving stock prices in the current economy.

sonic
DayTradeToWin Review

22 Wins, 1 Loss with the Sonic Trading System

Hello, Traders! Yesterday, on November 8th, the Sonic Trading System delivered an exceptional session, yielding 22 winning trades with only one loss. Let’s dive into the trade details and see how the system effectively captured these winning setups. Trading the Friday Afternoon Market: Is It Worth It? While many traders focus on the Asia, London, or U.S. sessions, Friday afternoons can present strong trends that are often overlooked. Even as the week winds down, we found that the Sonic System still identified solid trade opportunities after 12:30 p.m. (New York time). Here’s how we used it to lock in win after win. Uninterrupted Wins: 16 Trades in a Row Right after noon, the system signaled a short trade, hitting the target right away. This was just the start; trade after trade lined up, each meeting its target in sequence: This pattern continued until we had 16 trades in a row, all winners. Maximizing Success with Smart Trade Management Managing each trade entry was essential to achieving these results. By allowing trades to retrace slightly before entering, we improved the risk-to-reward ratio, reducing potential losses. For example, rather than entering immediately at a specific level, we let the price come back to a more favorable point, making the stop-loss smaller and the reward more significant. Why Entry Timing Makes a Difference In trading, when you enter is just as important as where you place your stop and target. Well-timed entries can significantly reduce losses, as we saw with each of these trades. Entering at retraced levels increased our odds of success and enabled better risk management. Flexibility with the Sonic System: Manual and Semi-Automated Options While these trades were executed manually, the Sonic System offers the flexibility to use semi-automated tools, allowing you to set automated targets and stops right after entering a trade. You can choose your preferred approach based on how hands-on you want to be with each trade. Wrapping Up a Productive Day By the end of the day, the Sonic System proved once again to be a powerful tool, helping us capture high-quality setups in the final hours of the trading week. Whether trading long or short, this system’s reliable signals supported a productive session. If you’re interested in learning more about the Sonic System, visit daytradetowin.com and sign up for a free membership. You’ll get access to our ABC software trials and other unique strategies to help you build a consistent, price-action-focused approach. Let’s work together to make every trade count.

S&P 500
Market News

S&P 500 Surge Sparks Bubble Worries on Wall Street

Stifel’s Barry Bannister Warns: “The Train is Approaching Crazy Town” Wall Street bear Barry Bannister cautioned Thursday that the S&P 500 is entering “mania” territory, as surging valuations push stocks to expensive and potentially unstable levels. This rally, he says, may lead to a further near-term surge before a significant pullback looms on the horizon. In a report titled, “This is your conductor … the train is approaching Crazy Town,” Stifel’s chief equity strategist Bannister warns that even under a favorable scenario, where the U.S. achieves a “soft landing,” various factors—such as increased U.S. fiscal spending, China’s economic stimulus, and global geopolitical tensions—are amplifying the risks. These factors are pushing the S&P 500 toward valuation highs unseen in nearly 80 years. With the S&P 500 recently closing above 5,970, Bannister suggests a fair valuation would be closer to 5,250. He argues that the index is overvalued by about five multiples based on the financial conditions index and the cyclically adjusted price-to-earnings (CAPE) ratio. Reflecting on historical “manias,” Bannister believes the S&P 500 could climb into the low 6,000s this quarter before retracing to fair value around 5,250 by early 2026. He’s also closely watching for a possible resurgence in inflation, noting similarities to the late inflationary stages of past periods like 1932-39, 1945-52, and 1967-74. If inflation does rise in a similar pattern, Bannister sees a high-risk period ahead for investors, especially during the final year of Fed Chair Jerome Powell’s term (May 2025 to May 2026). He adds that political pressures around the 2026 U.S. midterm elections could further amplify these risks. Bannister also notes that the S&P 500’s rising price-to-earnings (P/E) ratio, alongside the performance of growth stocks over value stocks, both appear overstretched. “Following recent political shifts, we may see a pullback in growth as fiscal populism, potential reflation, and geopolitical factors come into play,” he says. Historically, defensive stocks have tended to perform well during periods of slowing economic growth. Bannister suggests that the current environment favors “defensive value” sectors, including healthcare, utilities, and consumer staples, along with high-quality stocks.

Scroll to Top