sonic
DayTradeToWin Review

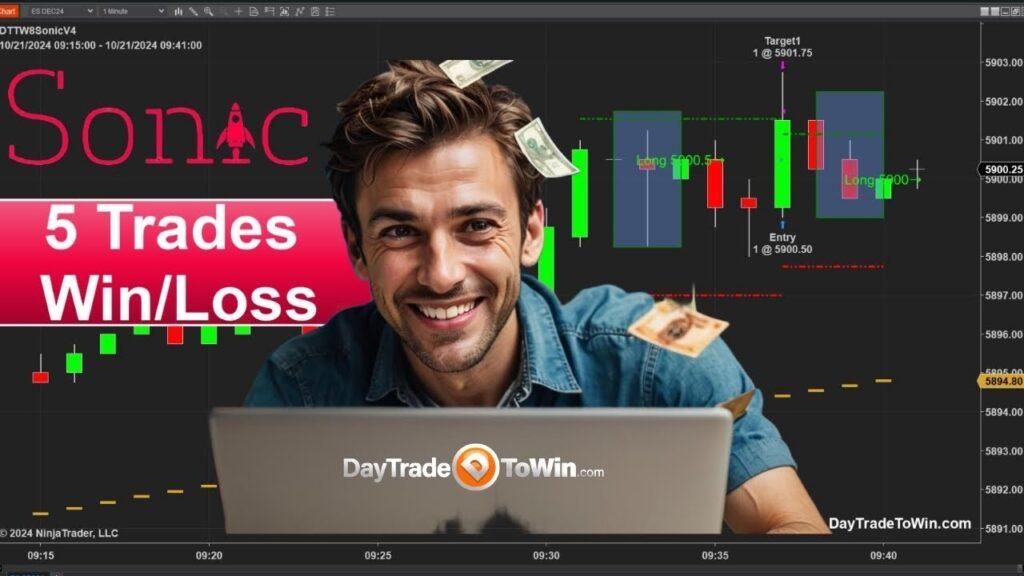
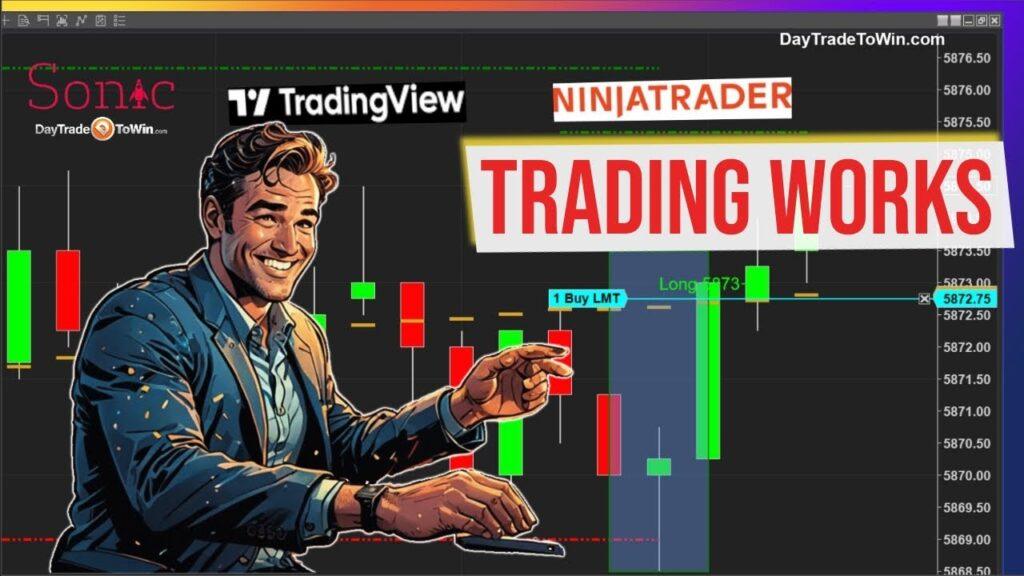
How 8 Trades Prove the Sonic Trading System Works

Today, we’re diving back into the Sonic Trading System, following up on yesterday’s session where we executed five trades consecutively. Our goal today is to build on that momentum, analyzing market activity from the opening bell and tracking trades throughout the day. Trading carries significant risk, and it’s important to only use capital you can afford to lose. Always be aware of the downsides and protect your capital by using stops strategically. Today’s Performance We kicked off the day around 11:00 AM with several trades on the Sonic system. Our first long signal appeared at 58.73, but I missed the fill by a tick while recording. Missing a fill is part of the game—never chase the market. Successful trading demands patience. Here’s how things stand so far: With a 5-to-1 win-loss ratio, today’s performance is exactly what you want from any trading system. The Sonic system has consistently demonstrated an ability to capture quick profits, and today is no exception. Example Trade Breakdown Our next trade came in at 58.78.50, with the target set at 58.88.75—a 2.25-point move, translating to over $100 per contract. Even accounting for slippage and fees, this trade yielded a solid profit, and it only took a few minutes to reach the target. The Importance of Price Action Price action trading focuses on reacting to the market rather than trying to predict its next move. In this case, we took a long position, and within minutes, the trade hit its target. Fast, decisive profits are ideal, and if a trade lingers too long or moves sideways, it’s often better to exit early and move on to the next opportunity. Sonic System Flexibility The semi-automated nature of the Sonic trading system makes it compatible with funded trading programs like Apex or Topstep, which often don’t allow fully automated strategies. The system is a hybrid approach, emphasizing price action over traditional indicators. The flexibility of Sonic is great for both NinjaTrader and TradingView users, as you can customize your stop losses and targets to match your trading style and risk tolerance. Whether you prefer tight stops or larger profit targets, the system allows you to adapt accordingly. Trade Recap This trade played out in less than 10 minutes, demonstrating the power of Sonic in fast-moving markets. When you’re on the right side of a trade, quick exits with profits in hand are the ultimate goal. Wrapping Up If you’re new to Sonic or price action trading, now is a great time to get involved. With a free membership at DayTradeTowin.com, you can access essential tools like free software and courses to get you started. Our system integrates seamlessly with both NinjaTrader and TradingView, and for those looking to dive deeper, we offer an Accelerated Mentorship program that bundles all our tools and training into one complete package. Be sure to subscribe to the DayTradeTowin YouTube channel for daily updates and insights, or visit our website to create your free member account. Trade smart, stay safe, and always prioritize risk management!

S&P 500
Uncategorized

Goldman Sachs Warns of Dismal S&P 500 Returns

A report from David Kostin, chief U.S. equity strategist at Goldman Sachs, recently added fuel to this discussion. Kostin cautioned that the S&P 500 could be heading for one of its weakest stretches of returns in nearly a century. His warning echoed earlier concerns from strategists at J.P. Morgan and GMO, as well as Apollo Global Management’s chief economist, Torsten Slok, who predicted that the S&P 500 might see average annualized returns of less than 3% over the next three years, based on current valuations. Stocks have enjoyed an extraordinary run over the past decade, but the coming years may not be as promising. Increasingly, market experts are warning of a potential “lost decade,” where returns could fall well short of the gains investors have grown accustomed to over the past 15 years. Kostin’s forecast is even more pessimistic, suggesting the S&P 500 could deliver average annual returns of just 3% over the next 10 years. This would significantly lag behind the average return of the past decade and would fall well below the long-term average since 1928. Goldman attributes this gloomy outlook to two main factors: elevated stock valuations and extreme market concentration. Currently, the cyclically adjusted price-to-earnings (CAPE) ratio for the S&P 500 stands at 38 times forward earnings, a level not far from its dot-com bubble peak. Even more concerning is the unprecedented concentration in the market, with a handful of large companies holding significant weight in the index. According to Goldman, this level of concentration is the highest seen since the early 1930s. High concentration has historically weighed on stock returns because dominant companies often struggle to maintain their competitive advantages over time. Kostin noted that, without this concentration, Goldman’s forecast for S&P 500 returns would be four percentage points higher. In light of these risks, Goldman suggests that Treasurys could outperform the S&P 500 over the next decade, while the equal-weighted version of the index is also expected to outperform its capitalization-weighted counterpart. Still, Kostin acknowledged that a few factors could improve the outlook. Stronger-than-expected productivity growth or corporate tax cuts could help support higher valuations and extend the market rally. Another recent analysis, from GMO’s Ben Inker, highlighted that periods of poor returns, or “lost decades,” have been more common than many investors realize. These periods typically begin when both stocks and bonds are trading at high valuations, much like today. While there are reasons for optimism—such as strong economic growth, falling inflation, and interest rate cuts—high valuations remain a point of caution. As Aya Yoshioka, portfolio consulting director at Wealth Enhancement, noted, “There are a lot of things to like about this market, but valuations aren’t one of them.” Despite recent record highs, U.S. stocks slipped earlier this week, with the S&P 500 and Dow Jones retreating while the tech-heavy Nasdaq Composite edged higher.

sonic
DayTradeToWin Review

A Day in the Life of a Sonic Trader: 5 Live Trades Analyzed

Hello Traders! Today is Monday, October 21st, and I’m excited to dive into the Sonic Trading System with you. I’ll be walking you through the first five trades of the day, showing the results in real-time to give you a clear picture of how the Sonic system performs in both winning and losing scenarios. Trade #1: Kicking Off with a Win The market opened at 9:30 AM New York time, and we quickly got our first signal to go long at 5950. I entered right at the target price, and within moments, the target was hit. This fast movement is typical at market open, where volatility tends to spike. While it’s tempting to jump in right away, especially with strong momentum, I always advise new traders to wait 5-10 minutes to let the initial volatility settle down. Whether you’re trading the NASDAQ, crude oil, or gold, this rule applies. The open can be unpredictable, so patience is key. The first trade was a winner, using the default settings of the Sonic system. Sonic Trading System Overview The Sonic Trading System is unique in that it’s based on price action—no momentum indicators, moving averages, or Keltner channels here. The signals are generated purely by analyzing price patterns and trends. That dashed line you see on the chart? It’s a filter. If the price is above the line, we focus on long trades, and if it’s below, we switch to short trades. This filter is adjustable to suit your strategy. Overtrading is a common issue, so we emphasize taking only the best setups. If a stop is too large or if the market conditions aren’t right, don’t force the trade. In our daily training sessions, we drill this into our traders. Many traders combine Sonic with other systems like the Roadmap or Atlas Line. It can be a great addition to your day trading toolbox. Remember, if there’s a high-priority news event, it’s better to avoid trading. You can download our free news indicator on DayTradeToWin.com to stay on top of major events. Trade #2: A Small Setback The second trade was a signal at 5900. The setup looked good—target and stop at a 1:1 ratio. However, this one didn’t go in our favor. After entering, the market went against the position, and the trade was stopped out. That’s part of the game. No system wins 100% of the time, but the Sonic system aims for a balanced risk-to-reward ratio on every trade. Adapting to Different Markets One of the best features of the Sonic system is its adaptability. It works on any market: NASDAQ, Dow, currencies, you name it. That’s because it’s entirely based on price action, which is universal across markets. For instance, during our third trade, we got a signal to go long at 5899.75. While some traders might enter immediately, I recommend aiming for a better price, even if it’s just a tick or two. A small improvement in entry can make a big difference, especially if the stop is a bit too far from the target. Trade #3: A Strong Comeback Our third trade hit the target with precision. The entry, stop, and target were well-balanced, and the market followed through nicely. Using a one-minute chart, we got a quick resolution to the trade—something you can expect if you prefer smaller time frames. If you’re more of a long-term trader, you can still use Sonic with higher time frames like 5-minute or even tick charts. It’s highly versatile and gives traders control over how they want to trade. ATR-Based Targets and Quick Profits The Sonic system uses the Average True Range (ATR) to calculate profit targets. This means that the size of the target adapts to the volatility of the market. If the market is moving fast, the target will be larger. If it’s slower, the target shrinks, making it more likely to hit. For quicker profits, you can even set the target to half of the ATR. This increases the chances of hitting the target sooner and getting out of the trade faster—a great approach if you don’t like holding positions for too long. Trade #4: A Missed Opportunity The fourth signal gave us an entry at 5927.5, but before I could place the order, the market had already gapped and hit the target. Sometimes, the market moves too fast, and there’s no reason to chase a trade. If it’s missed, it’s missed. Discipline is crucial in trading. Trade #5: Closing Strong The fifth and final trade of the day gave us another solid setup at 5991.25. I took my time analyzing the trade, considering the stop and target. Once again, the Sonic system delivered a balanced risk-to-reward ratio, and the target was hit almost immediately. The key takeaway here is not to rush your trades. You always have control—analyze the setup, determine if the stop is manageable, and only enter if the trade makes sense for you. Wrapping It Up In just a few hours, I completed five trades using the Sonic Trading System. With three wins and one loss (plus one missed opportunity), the system performed as expected. The beauty of Sonic is its simplicity, focusing purely on price action with no reliance on complex indicators. If you’re interested in adding the Sonic system to your trading arsenal, or want to learn more about our other systems like the Roadmap or Atlas Line, visit DayTradeToWin.com. You can also sign up for a free member account to access helpful tools like the news indicator and trial versions of our software. Ready to take your trading to the next level? Join our accelerated mentorship program and get instant access to all our courses and software. Let’s trade the right way—by understanding price action. Visit DayTradeToWin.com and sign up for your free account to access free trading tools and trials.

markets
Market News

U.S. Exceptionalism: Markets Gains and Potential Pitfalls

BNP Paribas and UBS Global Wealth Management Highlight U.S. Economy’s Resilience The U.S. economy is once again in the spotlight, with The Economist calling it the envy of the world in a recent cover story. While some, like Brett Donnelly from Spectra Markets, have noted that such magazine covers often signal a contrarian view, it’s not just The Economist that is praising U.S. economic strength. BNP Paribas strategists are focusing on U.S. resilience as policymakers and market participants head to Washington D.C. for the International Monetary Fund and World Bank meetings. They pointed out that the Atlanta Fed’s Q3 GDP growth forecast is an impressive 3.4% annualized, while the eurozone is expected to grow just 0.3% quarter-on-quarter. This means U.S. growth is likely to triple that of the eurozone in the third quarter. This performance difference is reflected in the markets. The spread between one-year forward rates in the U.S. and eurozone has widened by 60 basis points over the past month, with the U.S. dollar index rising 3%, and the S&P 500 outperforming the Euro Stoxx 50. In terms of central bank strategy, the Federal Reserve faces uncertainty heading into its next meeting, relying on current data to potentially support a quarter-point rate cut in November. In contrast, the European Central Bank has been more reactive to recent data, cutting rates unexpectedly just five weeks after hinting that a cut was unlikely. UBS Global Wealth Management has also revised its outlook, raising its target for the S&P 500 from 6,200 to 6,300 for June, and introducing a year-end 2025 target of 6,600. UBS cited a more resilient labor market, stronger-than-expected economic performance, and a medium-term growth rate above the Fed’s long-term projection of 1.8%. This strength, combined with falling inflation, has reinforced UBS’s positive view on U.S. equities for the future.

market
Market News

How the Market Bets on the Next President

The Dow Jones Industrial Average’s performance as a predictor of U.S. presidential election outcomes warrants serious consideration. There is a strong correlation between the Dow’s year-to-date return through mid-October and the chances of the incumbent party winning the presidency. This relationship is statistically significant at a 97% confidence level. Currently, the Dow’s impressive year-to-date return suggests a 72% probability that Vice President Kamala Harris, the Democratic candidate, will win the November election. Just two months ago, the Dow indicated a 64% chance of her victory, and in May, that figure was 58%. These rising probabilities are driven by the stock market’s gains, as historical data reveals a strong link between the Dow’s performance in an election year and the incumbent party’s likelihood of success. It’s worth noting that this 72% probability stands in contrast to the 43% chance assigned by electronic futures markets, as aggregated by Election Betting Odds. Which forecast should you trust? There is no clear-cut answer. Electronic futures markets are relatively new, with limited data to establish a strong track record. The Dow, however, has over a century’s worth of data, covering more than 30 presidential elections since the late 1800s. My analysis shows that the correlation between the Dow’s year-to-date performance by mid-October and the incumbent party’s chances of winning is statistically significant. The data shows a clear pattern: The logic behind using the stock market as a predictor is that it serves as a leading indicator of the economy’s future performance, and voters tend to base their decisions on their financial situation. While consumer sentiment has been weak this year despite a strong stock market, statistical analysis shows that the stock market remains a more reliable predictor of election outcomes than consumer sentiment. In summary, the Dow’s performance as an election predictor is backed by significant historical data and deserves to be taken seriously.

ETFs
Market News

Chinese Stock ETFs Struggle Amid Stimulus Doubts

Yardeni Research remains unconvinced that recent stimulus measures will make China a more attractive investment than the U.S. or India, stating that “it would take much more than interest-rate cuts, easier financing, and fiscal stimulus.” Chinese stocks have been under pressure, with recent declines wiping out gains from the September rally driven by China’s stimulus announcement. “Investors appear to have lost faith that government intervention will resolve the deeper issues in China’s economy,” Yardeni Research commented in a recent briefing. “The quick rally in Chinese equities now looks short-lived.” Exchange-traded funds (ETFs) investing in Chinese stocks have struggled. The iShares MSCI China ETF (MCHI) is on track for a 5.6% drop this week, despite a sharp increase on Wednesday, following a 7.7% loss last week. Other China-focused ETFs have fared even worse, extending their October losses. For example, the Invesco China Technology ETF (CQQQ) and KraneShares CSI China Internet ETF (KWEB) both saw weekly losses of around 7.5%, while the Invesco Golden Dragon China ETF (PGJ) dropped 7%, according to FactSet data. So far this month, these ETFs have continued their downward trend, with KWEB down nearly 5%, and MCHI retreating over 2%. “Aside from the risks of investing in China, corporate earnings have been stagnant for the past 15 years and have consistently disappointed since 2022,” Yardeni noted. “It’s easier to manipulate national growth numbers with government projects, but corporate earnings tell a more truthful story.” China faces nearly $36 trillion in outstanding bank loans, which is three times the U.S. figure. Yardeni Research likened China’s current challenges to those the U.S. faced after the global financial crisis, suggesting that without a large-scale fiscal stimulus, similar to the U.S. response during the pandemic, China may struggle to reignite growth and inflation. Consumer confidence in China has collapsed, and Yardeni pointed out that higher stock prices alone won’t be enough to boost spending. With China’s housing minister set to announce more measures to support the property sector, Yardeni remains skeptical. “Trying to stimulate an over-leveraged economy with easier financing may not be the solution. It will take time for consumers and businesses to rebuild their balance sheets after a period of excessive debt,” the firm concluded.

Scroll to Top