gold
Market News

Gold Surges Ahead of Stocks and Bonds in Q3

The SPDR Gold Shares ETF saw a strong surge in the third quarter, fueled by growing investor optimism that the Federal Reserve could successfully achieve a “soft landing” for the U.S. economy. By the end of September, many investors appeared more confident that the Fed could lower inflation without triggering a recession. “There’s more confidence that we’re going to stick the soft landing,” said Michael Arone, chief investment strategist at State Street Global Advisors. However, Arone also noted that such outcomes are rare, and gold’s strong performance suggests that some investors are still hedging against economic risks. The SPDR Gold Shares ETF (GLD), which invests in physical gold, has soared 27.1% this year, including a 13% rise in the third quarter. This outpaced the S&P 500, which gained 5.5% during the same period and is up 20.8% for the year. September marked the start of the Fed’s interest-rate-cutting cycle, with the central bank opting for a larger-than-expected half-point reduction. This move sparked a rally in U.S. bonds, as the iShares Core U.S. Aggregate Bond ETF (AGG), which tracks investment-grade bonds, gained 5.3% in the third quarter. Meanwhile, riskier corporate bonds, like the iShares iBoxx $ High Yield Corporate Bond ETF (HYG), saw a 5.7% gain. Despite the optimism, Arone recommends maintaining a small allocation to gold as a hedge against potential risks. He suggests that long-term investors consider a 3% to 10% allocation, emphasizing that falling interest rates make gold an increasingly attractive asset. As the “opportunity cost” of holding gold declines, it remains a valuable safeguard, especially if the economic outlook shifts unexpectedly.

price action
DayTradeToWin Review

How Market Manipulation Impacts Price Action

In the world of trading, no two scenarios are identical. Each market event presents unique challenges and subtle differences. Seasoned traders recognize the impact of market manipulation on price action, often misleading less experienced participants. When a large price move occurs—such as a significant candle—it typically results from a surge of orders hitting the market simultaneously, overwhelming either buyers or sellers. The Trap of Traditional Indicators Many traders heavily rely on traditional indicators like moving averages or MACD (Moving Average Convergence Divergence). These tools often signal “buy” when a trend appears favorable, drawing traders into positions. However, even when all indicators point to a bullish scenario, unforeseen events can lead to sudden reversals. This can catch traders off guard, as many rush to exit long positions, or professional traders take profits at key price levels. These sudden moves are often orchestrated by experienced market players who have been quietly accumulating positions and are now selling off. This classic form of manipulation can leave the majority of traders blindsided. The Value of Price Action and Volatility To navigate these market traps, traders need to focus on price action. Unlike traditional indicators, price action reflects real-time market behavior. One effective approach is using a “roadmap” based on key price zones and market volatility. For example, in a highly volatile market, the initial reaction zone (the first price movement after volatility spikes) might not be reliable. When the Average True Range (ATR) is elevated—five or eight points, for instance—traders should concentrate on further-out zones to find more dependable trading opportunities. These distant price levels offer a clearer picture of market direction and highlight where professional traders may be making their moves. Position Yourself for the Right Opportunity Understanding accumulation and distribution phases is crucial for traders aiming to stay ahead. By identifying how markets tend to behave, you can position yourself to take advantage of optimal trade entries. The greater the volatility, the more important it is to focus on the right zones and avoid getting caught up in the initial frenzy. This patient approach allows you to avoid the noise and capitalize on significant market movements. Take Control of Your Trading To succeed in trading, relying solely on conventional indicators isn’t enough. Mastering price action and recognizing market manipulation will give you an edge. If you’re interested in exploring this approach further, DayTradetowin.com provides valuable resources, including a free membership and access to trial software like the ABC system. Start trading with a focus on price action, and avoid falling into the common traps of traditional indicators. Take control of your trading strategy today.

market
Market News

World Market Cap Crosses $123 Trillion: What’s Next?

Strategists Suggest Industrial Metals, Materials, and International Stock market as Top Plays for China’s Rally Global stock market capitalization is on track to surpass its highest level in three years, driven by the Federal Reserve’s interest rate cuts and China’s latest economic stimulus efforts. Bank of America, citing data from GFD Finaeon, predicts global market cap will soon exceed the record $123 trillion reached in October 2021. The Vanguard Total World Stock ETF (VT), which tracks U.S. and global stocks, has already hit a new all-time high, overtaking its 2021 peak. According to Bank of America strategists led by Michael Hartnett, markets typically stabilize when policymakers intervene—exactly what’s happening now. China’s recent stimulus measures came on the heels of a half-point interest rate cut by the Fed, leading to a strong rally in Chinese assets. The Hang Seng Index jumped 13% this week, its best performance since 1998. With the Fed’s rate cuts and no recession on the horizon, risky assets are gaining momentum. Investors see the policy actions from the Fed and China as sufficient to reduce recession risks. Bank of America strategists advise that the best way to profit from China’s economic rally is by investing in industrial metals, materials, and international stocks, particularly as long as China’s 10-year yield stays above 2%. Currently, the yield stands at 2.17%.

over-trading
DayTradeToWin Review

Stop Over-Trading: Boost Your Profits with Discipline

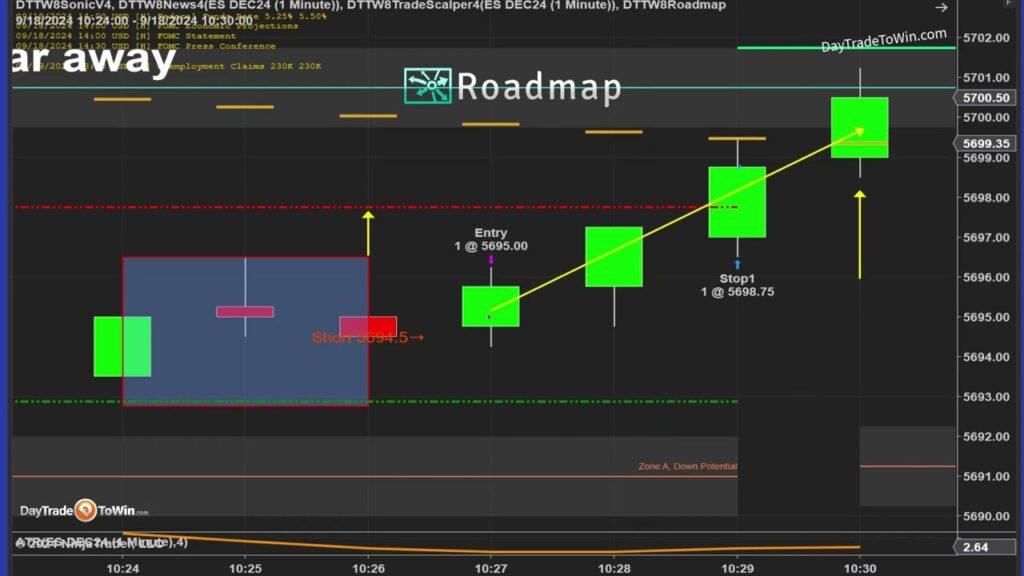
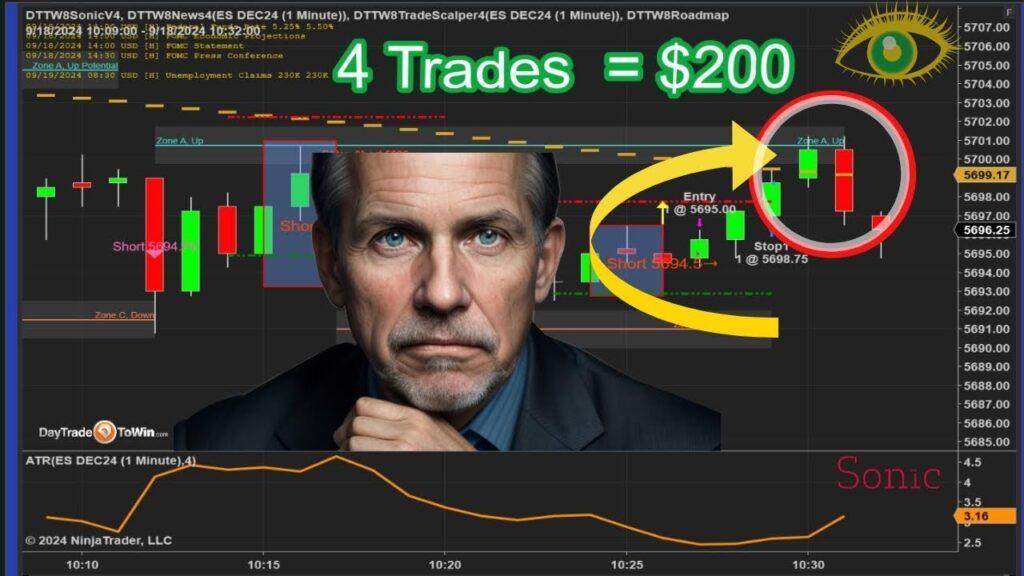
Over-trading is a common pitfall in day trading, leading to excessive risk and diminishing returns. Many traders, fueled by the excitement of the market, make numerous trades without a solid strategy. By the end of the day, they may find they’ve gained little—or worse, lost ground. In fact, trading excessively can erode your profits and take a toll on your mental well-being. Why Over-Trading Can Hurt Your Success As highlighted in the transcript, trading constantly throughout the day without clear gains is a recipe for failure. Making frequent trades doesn’t guarantee better results and often leads to a loss of focus. The key lesson here is to prioritize quality over quantity. For instance, if you make five to ten trades in a day and end up profitable, that’s great! That’s a signal to stop. One of the biggest mistakes traders make is continuing to trade after reaching their goal, driven by overconfidence or greed. At that point, you risk not just your profits but also your emotional discipline. The secret is to make fewer trades with clear intent. Breaking your day into manageable sessions—such as taking a few trades in the morning and again in the afternoon when market volatility is higher—helps maintain focus and balance. Set Clear Targets and Stop Once You Achieve Them Let’s say each point on a trade is worth $50, and after four trades, you’ve made $200—that’s a solid stopping point. From there, consider scaling up your contracts as your confidence and account size grow. The goal is not to take more trades but to trade more strategically. This also means recognizing when the market has moved past an ideal entry point and resisting the urge to chase. Jumping in after missing the optimal entry often results in poor outcomes. For example, if the market hits a key roadmap zone and reverses immediately, you may be too late to benefit. Entering after a move can put you at a disadvantage, especially if seasoned traders have already profited from the shift. Timing Is Critical: Strategic Entries Matter Discipline is key when entering trades. Spotting a roadmap zone and placing a limit order just a few ticks higher can help you secure a better price. This approach not only minimizes risk by keeping you closer to your stop but also ensures you’re entering at a favorable point. Of course, not all trades will work out perfectly. The transcript reminds us that sometimes the market moves unexpectedly. If it “runs away” from you, don’t chase it. Accept that you missed the trade and move on. The market offers countless opportunities, so there’s no need to rush or force a bad trade. Final Thoughts: Patience Over Prediction Nobody can predict the market with certainty. The best approach is to make informed, well-timed decisions. Forcing trades or over-trading leads to burnout and potential losses. By sticking to a clear plan and focusing on quality trades, you’ll be in greater control of both your strategy and your results. Day trading isn’t about sitting in front of a screen all day, clicking buy and sell. It’s about observing the market, exercising patience, and entering trades when the risk-to-reward ratio is in your favor. Want to learn more advanced trading techniques? Join our community at DayTradetowin.com to access free trials, expert educational resources, and our powerful ABC software. Start trading smarter and master price action strategies today!

Economic Data
Market News

Why Investors Are Obsessed with Economic Data

Investors are increasingly jittery about economic data, even reports that once flew under the radar. As the Federal Reserve works to lower interest rates and guide the economy toward a soft landing, market reactions have become more pronounced. While crucial reports like monthly job numbers still draw attention, even routine data releases now have the power to move markets. Jack Janasiewicz, a portfolio manager at Natixis Investment Managers Solutions, attributes this to investors being “hyper-sensitive” to the constant stream of news, leading to swift and sometimes exaggerated market reactions. Bespoke Investment Group analyzed 25 years of data and found that Wall Street has seen greater volatility in the last four years, especially on days when economic data is released. Before the pandemic, the S&P 500 averaged a daily move of 0.81% on such days, but that figure has risen to 0.94% since March 2020. In their analysis of 34 economic indicators, Bespoke noted that previously overlooked data points have gained importance. Releases like the University of Michigan’s consumer confidence survey, ADP private payrolls, and durable-goods orders now frequently coincide with significant market moves—often 1% or more. Prior to the pandemic, such sharp reactions were rare. Jeffrey Roach, chief economist at LPL Financial, pointed to the Labor Department’s JOLTS report as a prime example of a dataset that has become a focal point during the recent economic tightening. Once ignored, it’s now closely watched, especially as the Fed monitors labor tightness through the openings-to-unemployed ratio. Market volatility has also surged around inflation data and Federal Reserve decision days. Before the pandemic, the average daily market move on Fed-decision days was 0.88%, but this has jumped to 1.17% since 2020. Janasiewicz suggests that rising market leverage and the use of short-term options trading could be fueling these swings. Despite ongoing recession fears, recent economic reports have kept markets buoyant, with the S&P 500 and Dow Jones rallying on the back of strong data. However, Janasiewicz warns that investors remain on edge, poised to exit quickly at any hint of economic weakness, driven by the fear of getting caught in a selloff.

stocks
Market News

Stocks Set for a Dot-Com Bubble-Like Shift

This raises concerns about how much longer the rally can maintain its current momentum. The S&P 500 is nearing a rare milestone: a 20% or greater rise in two consecutive calendar years. As of Tuesday’s close, the index had crossed the 20% year-to-date mark, hitting its 41st record high of the year. Although the S&P 500 saw a slight pullback by the end of Wednesday, it remains near its peak. Following the Federal Reserve’s substantial interest rate cut, many investors are hopeful the index will push higher. It’s been a long time since the market experienced consecutive years of such strong performance. The last time was in 1998, during the dot-com boom, when the index posted four straight years of 20%-plus gains, starting in 1995. Before that, stocks hadn’t seen two consecutive years of such gains since 1955, before the S&P 500 was introduced. With the S&P 500 up 60% from its October 2022 low, according to FactSet data, investors are beginning to wonder how much further large-cap U.S. stocks can rise and whether this remarkable bull market may be nearing its peak. Some have suggested shifting away from large-cap stocks in favor of small- and mid-caps or looking for bargains abroad. Others argue that large-cap stocks still offer the best potential for returns, even as valuations have climbed to historically high levels. The comparison to the dot-com era is hard to ignore. While many experts are quick to point out the differences, it’s notable that technology stocks are once again leading the charge. Information technology and communication services now represent a significant share of the S&P 500’s market value, and valuations relative to sales are even higher than they were in 1999, according to FactSet. However, today’s companies are much more profitable than they were in the late 1990s. Recently, the S&P 500’s forward price-to-earnings ratio was 21.6, lower than the 24 times earnings seen in late 1999. Some analysts caution that high valuations could set the stage for below-average returns over the next decade. But others, like those at Yardeni Research, believe that strong earnings growth and improving productivity will continue to support the market, pushing it higher through at least 2030. While tech stocks may not dominate the market as much as they did earlier in this rally, other sectors—such as financials, industrials, and utilities—have begun to play a larger role. If these lagging sectors continue to gain momentum, the broader market could sustain its upward trajectory. Historically, following a 20% return, the S&P 500 has averaged a 9% gain the following year. While the pace may slow, history suggests that the rally could still continue.

Scroll to Top