stock
Market News

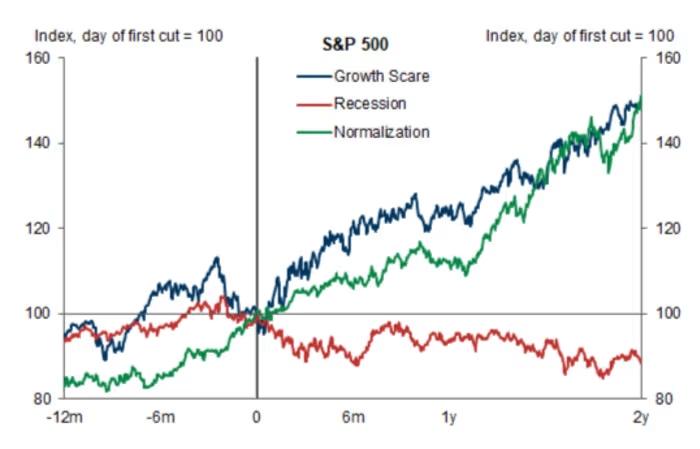
How Fed Rate Cuts Have Moved Stock Before

Whether the Federal Reserve can prevent a recession in time could be crucial. A Fed interest-rate cut on Wednesday seems all but certain, but how the stock market reacts to this loosening of monetary policy remains highly uncertain. History offers some insight: why the Fed is cutting rates matters more for markets than the mere fact that borrowing costs are falling. Vickie Chang, a macro strategist at Goldman Sachs, noted that since the mid-1980s, the Fed has cut rates 10 times. Four of those cuts were during recessions, while six were not. When the Fed managed to avoid a recession, stocks typically rallied. When it failed, stocks usually declined. Investors likely won’t get all the answers on Wednesday. How the market responds will depend on economic data in the months ahead. “The key question is whether this rate-cutting cycle is due to a ‘growth scare’ or a more serious ‘recessionary’ phase,” Chang said. In recessionary rate cuts, the S&P 500 typically drops 10% within the first six months. What will Wednesday’s cut reveal about the economy? The size of the cut could heavily influence investor sentiment and potentially shape market behavior for the rest of the year. Investors are particularly eager for clarity, given the mixed signals from recent U.S. economic data. While hiring has slowed, more people have entered the workforce, and layoffs remain low. Inflation has eased, but certain costs, like rent and housing, remain stubbornly high. Optimism earlier in 2024 fueled stock gains, but investor confidence has since been shaken, leading to selloffs in August and September, as concerns about rising unemployment grew. Has the Fed fallen behind? Some experts believe the Fed should have cut rates back in July, and a larger-than-expected 50 basis point cut this Wednesday could spark a negative reaction in the stock market. Wall Street sees such a move as a sign that the Fed may have fallen behind or is reacting to worse-than-expected economic data. Shannon Saccocia, CIO at Neuberger Berman Private Wealth, said, “A 50 basis point cut would suggest the Fed missed the window in July or has more worrying data than we’ve seen.” This uncertainty could trigger a market selloff regardless of the Fed’s decision, according to Deutsche Bank strategists. They noted that the Fed could deliver the biggest market surprise in 15 years, regardless of the cut’s size. Beyond the cut itself, the Fed’s updated economic projections will be carefully scrutinized. John Velis, a macro strategist at BNY Mellon, anticipates that the Fed will revise its unemployment forecast higher while lowering GDP growth projections. While this may not signal a recession, it could influence how aggressively investors expect the Fed to cut rates moving forward. On the edge of a historic achievement Though there are no clear signs of a recession yet, investors remain cautious. If Fed Chair Jerome Powell can guide the economy through inflation without causing a downturn, it would be a monumental achievement. KPMG U.S. chief economist Diane Swonk pointed out that achieving a soft landing would be unprecedented. While inflation complicates the current situation, the Fed has successfully navigated difficult economic conditions before. In 1995, a series of rate cuts helped avoid a recession, according to Jurrien Timmer, global macro director at Fidelity. “It’s rare, but it’s possible,” Timmer told MarketWatch. Last week, the S&P 500 and Nasdaq Composite posted their biggest weekly gains since November 2023, with the Dow Jones Industrial Average also seeing its best week in a month. The Fed’s two-day September policy meeting starts Tuesday, with the interest-rate decision to be announced Wednesday at 2 p.m. Eastern Time.

sonic trading
DayTradeToWin Review

Day Trading NASDAQ & E-mini S&P: Sonic Strategy

Hello traders! In today’s session, we’ll explore how to effectively trade both the NASDAQ and E-mini S&P 500 simultaneously using the Sonic Trading System. Whether you’re new to trading or an experienced pro, this guide will help you leverage price action strategies for success in fast-moving markets. What’s New with the Sonic Trading System? For those already using the Sonic Trading System, exciting updates are on the way! You’ll soon be able to customize the color of your targets, stops, and line thickness, based on the latest feedback from traders. This will improve your chart’s visual clarity and make it easier to execute trades swiftly. Expect this update by the end of the week! Risk Disclaimer: Trade Wisely Before we dive in, a quick reminder: trading involves risk. Only trade with money you can afford to lose, and ensure you understand the potential risks before entering the market. Why Use a 30-Second Chart for the NASDAQ? The NASDAQ is known for its volatility and speed, making it ideal for shorter timeframes like a 30-second chart. This allows you to capture quick price movements without holding positions for long periods. Many traders prefer the Sonic system for this market because it helps them make fast, decisive trades. Today, I’ll walk you through how to trade the NASDAQ and E-mini S&P side by side, giving you a clear view of how price action works in both markets. Executing a Short Trade on the Micro E-mini NASDAQ Let’s start with a short trade at 1877.25 in the Micro E-mini NASDAQ. Once you receive the entry signal, it’s crucial to adjust your targets and stops according to the Sonic system’s rules. You’ll see green and red lines on your chart representing your target and stop positions. In the upcoming system update, you can change these colors to suit your preference—for example, using yellow instead of green for targets. This flexibility helps you visually track your trades, especially in a fast-paced market like NASDAQ. Short Trade on the E-mini S&P 500 Next, we’ll look at a short trade on the E-mini S&P 500. While the S&P tends to move at a slower pace compared to the NASDAQ, the principles of the Sonic system still apply. Using a 1-minute chart for the E-mini, you’ll find that trades take a bit longer to generate, but they’re just as effective. Always aim for a better price when placing your trade. This is something we emphasize in the Sonic system training. A small improvement in entry price can make a big difference in your trade’s success. Managing Your Trades with the Sonic System A key aspect of trading with the Sonic system is time management. You should avoid staying in a trade for too long. The Sonic system’s time-based stops are designed to help you get out of unproductive trades quickly. Ideally, trades using short timeframes like the 30-second chart should last no more than 10-15 minutes. If the market isn’t moving in your favor by then, it’s better to exit and avoid unnecessary risk. Start Small and Scale Up Gradually If you’re new to the Sonic system, start with just one contract—whether it’s a micro or mini. This allows you to get comfortable with the process without exposing too much capital. As you gain confidence, you can scale up to two, three, or more contracts, depending on the market conditions. Starting small and gradually increasing your trade size is key to long-term success. Explore the Accelerated Mentorship Program If you want to take your trading to the next level, consider enrolling in our Accelerated Mentorship Program. This comprehensive package includes all our trading courses, proprietary software, and live training sessions, where we showcase the Sonic system in action. You’ll also get access to our live trading room, where you can see real-time examples of trades using the Sonic system and other strategies. The Sonic system, when combined with disciplined time management and a focus on price action, is a powerful tool for day traders. Whether you’re trading the NASDAQ, E-mini S&P, or another market, the key is to stay patient, follow your strategy, and avoid overtrading. Conclusion: Ready to Level Up Your Trading? If you’re interested in learning more about the Sonic Trading System, visit DayTradeToWin. You can sign up for a free membership and get access to our proprietary tools, including the Sonic system. Until next time, trade smart and happy trading!

Small-Cap Stocks
Market News

Why Small-Cap Stocks Are Beating the S&P 500 Now

On Thursday, the Russell 2000 index, which focuses on small-cap stocks, saw a strong rise, underscoring the recent outperformance of U.S. small-caps over the S&P 500 in the third quarter. Despite experiencing steeper losses than large-cap stocks in September, small-caps have shown resilience. “Small-cap stocks got a boost when the Federal Reserve signaled a shift toward easier monetary policy,” said Liz Ann Sonders, chief investment strategist at Charles Schwab, in a Thursday phone interview. This shift became evident at the Jackson Hole Economic Symposium in late August. “Small caps tend to benefit during rate-cutting cycles,” she explained, though the effect is usually stronger when cuts are made in response to a recession. “But we’re not in a recession,” Sonders pointed out. Despite some economic slowing, “the economy is still performing relatively well,” she added. The Russell 2000 has risen 4% this quarter, even after a 4% slide in September. By comparison, the S&P 500, which tracks large-cap stocks, has gained 2.5% for the quarter, though it has outpaced small-caps over the course of the year, according to FactSet data. Investors are looking ahead to the Federal Reserve’s policy meeting next Wednesday, anticipating an announcement of rate cuts. The Fed has kept rates at elevated levels since July 2023 after aggressively hiking them to combat inflation, which peaked in 2022 and has since cooled toward the central bank’s 2% target. As of Thursday, traders in the federal funds futures market placed a 69% probability that the Fed would lower rates by a quarter percentage point, bringing them to a target range of 5% to 5.25%, based on data from the CME FedWatch Tool. Sonders cautioned that those hoping for larger cuts should “be careful what you wish for,” as deeper cuts tend to occur during recessions or financial crises. The recent rally in small-caps has lost some momentum after traders adjusted their rate-cut expectations from half a point to a quarter point, triggering profit-taking. Sonders noted that small-cap stocks generally benefit more from lower interest rates than large-cap companies. She also advised focusing on higher-quality stocks within the small-cap space. “Small-cap stocks aren’t a monolithic group,” Sonders emphasized. There is a wide range of performance across the sector, typically driven by differences in quality. “As the economy slows, investors should seek opportunities in higher-quality small-caps,” she suggested. The S&P Small Cap 600 index, which applies a profitability filter, tends to consist of higher-quality stocks than the Russell 2000, Sonders noted. She suggested using the S&P 600 as a base when screening for investment ideas. On Thursday, small-cap stocks outperformed the broader market, with both the Russell 2000 and S&P Small Cap 600 gaining 1.2%, outpacing the S&P 500’s 0.7% increase. U.S. stocks overall rose, with the Dow Jones Industrial Average climbing 0.6% and the Nasdaq Composite advancing 1%. So far in 2024, the S&P 500 has gained 17.3%, significantly outpacing the Russell 2000’s 5% year-to-date rise, even as both stumbled in September. According to FactSet, the S&P 500 is down 0.9% this month, while the Russell 2000 has fallen 4%.

nvidia
Market News

Nvidia CEO Addresses Investor Concerns: What’s Next?

Nvidia stock has rebounded, climbing 4%, but investors are still asking a crucial question: Can artificial intelligence drive enough revenue to justify the massive spending on GPUs and other AI hardware? CEO Jensen Huang has faced this question repeatedly. While he addressed it during Nvidia’s August earnings call, the market reaction was lukewarm, with shares dropping after the report. Huang revisited the issue at a Goldman Sachs event, emphasizing the strong returns from AI infrastructure investments. According to Jensen Huang, every dollar spent on Nvidia’s AI hardware yields $5 in rentals worldwide, and demand is outstripping supply. He also highlighted how AI is boosting productivity within Nvidia, with software engineers using AI tools to streamline code development, essentially working alongside “digital companions.” Huang acknowledged that GPU costs can rise for customers, but with a 20x reduction in computing time, users still see a 10x return on investment. Despite Huang’s optimism, the question remains: Can Nvidia maintain its growth trajectory through 2026 and beyond, as tools like ChatGPT and Microsoft’s Copilot continue to transform industries?

Financial Stocks
Market News

Can Financial Stocks Maintain Their Bullish Run?

“The financial sector is much more than just banks,” says DataTrek Research. Financial stocks in the S&P 500 have outperformed the broader U.S. stock market over the past year, reflecting optimism about the economy, according to DataTrek. “Even if you’re not overweight on financials, their continued leadership reassures that equity markets are confident in further growth,” said Nicholas Colas, co-founder of DataTrek. The Financial Select Sector SPDR Fund (XLF), which tracks financial stocks in the S&P 500, surged 31.1% over the past 12 months, outpacing the S&P 500’s 22.7% rise, FactSet data shows. While the U.S. stock market has gained in 2024, investors are wary that the Federal Reserve’s tight monetary policy might trigger a recession. Despite this, Colas noted that the Atlanta Fed’s GDPNow model predicts solid economic growth in the third quarter, with a 2.5% estimate. “The financial sector extends beyond just banks, which only account for 25% of the index,” wrote Colas. It also includes growth-oriented companies like Visa, Mastercard, and S&P Global, as well as asset managers such as BlackRock, Blackstone, and KKR. Financials have continued to shine in 2024, with the Financial Select Sector SPDR Fund up 19.6%, outpacing the S&P 500’s 14.7% rise. However, Colas pointed out that while financials have outperformed by 8.4 percentage points, it’s still lower than past midcycle periods, such as 2017-18 when they led by as much as 20 points. On Tuesday, the financial sector in the S&P 500 faced a sharp drop as banks like JPMorgan, Goldman Sachs, and Citigroup saw steep losses. Investors are now looking ahead to new inflation data, set to be released Wednesday by the Bureau of Labor Statistics.

Goldman Sachs
Market News

Navigating Market Corrections: Goldman Sachs’ Guide

The S&P 500 had its worst week in 18 months, followed by its best day in three weeks on Monday, despite little new information. This highlights how uncertainty around interest rates and politics is likely to keep markets volatile in the coming months. Last month, 94% of global equity indexes experienced a drawdown of at least 5%, according to Goldman Sachs. Goldman Sachs strategists, led by Christian Mueller-Glissmann, now question whether the bull market will continue with strong returns or if there’s more volatility ahead and increased risk of drawdowns. Since 1928, the S&P 500 has faced 22 bear markets, with 20% declines happening roughly every four to five years. In the U.S., drawdowns of 10% to 20% occurred 15% of the time over any rolling 12-month period since 1973, with even higher frequency internationally. During these 10%-to-20% declines, the average drop was 13% and lasted about four months. However, they’ve become less frequent since the 1990s. Is buying the dip a smart move? It depends on the timeframe. Since 2010, buying corrections has generally paid off, but that wasn’t the case if you go back to the 1990s. After a market drop, lower valuations and bearish sentiment can create opportunities, but there’s always a risk of further economic and market downturns. Equity drawdowns also tend to tighten financial conditions, which can slow economic momentum further. Goldman Sachs has developed a model to predict drawdowns using various factors like economic indicators, volatility, inflation, and valuations. While the model’s accuracy is limited, with a correlation of 0.2 on a 0-to-1 scale, it shows stronger predictive power when the score rises above 30%. Right now, it’s at 20%, indicating moderate risk. In terms of portfolio strategy, the classic 60/40 split between stocks and bonds is performing well as concerns over economic growth help bonds, despite recent inflation. Goldman Sachs believes negative correlations between stocks and bonds will persist, but they suggest going beyond bonds for diversification. They recommend gold, the Japanese yen, and the Swiss franc, and favor defensive equities, especially in the U.K.’s FTSE 100.

Scroll to Top