roadmap
DayTradeToWin Review

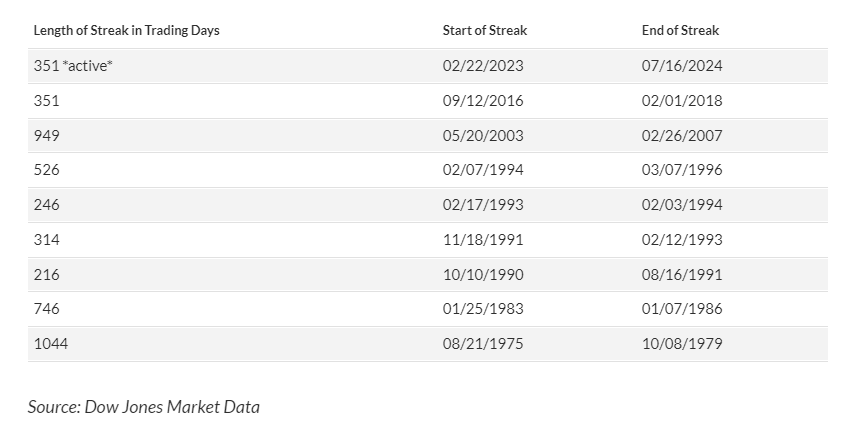
Roadmap: Is This the Ultimate Indicator for TradingView?

In the world of trading, finding the right indicators to guide your decisions is crucial. Among the myriad of options available, the “Roadmap” indicator from Day Trade to Win stands out as a game-changer for many traders. This blog post will delve into why this indicator might be one of the best on TradingView. What is the Roadmap Indicator? The Roadmap indicator is designed to highlight critical price zones on your TradingView charts. These zones, known as Roadmap Zones, help traders anticipate whether the price will break through or bounce off, providing valuable signals for making trades. Risk Disclaimer: Trading involves significant risks. Only trade with funds you can afford to lose. Key Features of the Roadmap Indicator Practical Application of the Roadmap Consider a scenario where the market hits a zone but doesn’t break through. Instead, it moves sideways, indicating that the support is holding. This could be a signal to go long. Conversely, if the price breaks through the zone, it might be a signal to go short. The “Zone A Up” Feature The Roadmap also includes a feature called “Zone A Up.” If the market reaches this zone and then reverses, it indicates a potential short trade. If it breaks through, it suggests a long trade. Filtering Trades A standout feature of the Roadmap is its ability to filter out false signals, ensuring that you only act on high-probability opportunities. This filtering helps in both trend and counter-trend trading, providing entries in the direction of strong trends and opportunities for counter-trend trades when reversals occur. Tips for Using the Roadmap Conclusion The Roadmap indicator on TradingView is a powerful tool that brings clarity to trading. By identifying key price zones and offering clear signals, it helps traders make informed decisions, potentially leading to better trading outcomes. If you’re seeking an effective indicator to enhance your trading strategy, the Roadmap is worth considering. For more information and to sign up for a free member account, visit Day Trade to Win. Join their live trading room to see the Roadmap in action and learn from experienced traders. Happy trading!

U.S. Stocks
Market News

Calm Before the Storm? What the Calm in U.S. Stocks Means for Your Portfolio

U.S. stocks are experiencing an unusually tranquil stretch poised to hit a new milestone on Wednesday as the rally expands beyond a few megacap names. If the S&P 500 avoids a significant selloff, it will mark 352 consecutive sessions without a 2% decline, the longest streak since February 2007. ETF and technical strategist Todd Sohn from Strategas explained to MarketWatch that while many investors brace for a pullback, historical data shows that periods of market calm can last much longer than expected. Over the past 50 years, there have been four instances where the S&P 500 went even longer without a 2% drop, with the longest being a 1,044-day stretch ending in October 1979. Sohn emphasized that excessive worrying about potential threats can lead to missed opportunities. Staying on the sidelines often results in greater losses than the selloffs themselves. “In and of itself, it isn’t really something to worry about,” he said, advising investors to remain focused on their long-term investment strategies. Despite recent risks, the rally has shown remarkable resilience. Paul Hickey, an analyst at Bespoke Investment Group, noted that even significant events, like a near-assassination of a leading U.S. presidential candidate and unexpected inflation data, haven’t derailed the market’s upward trajectory. The S&P 500 continues to reach new highs, even without contributions from key stocks like Nvidia. Hickey also pointed out the low volatility, with the Cboe Volatility Index (VIX) near its lowest levels since before the COVID-19 pandemic. A low VIX indicates a solid rally but also hints at potential investor complacency, especially as stocks enter their historically weakest three-month period from mid-July to mid-October. While the S&P 500 hasn’t seen a 2% drop in a single day recently, there have been pullbacks, including a 10% correction ending in late October and a 5% drop in April. As fall approaches, the market faces risks from U.S. politics, a cooling economy, and potentially disappointing corporate earnings. Wall Street experts, including those from Citigroup and Goldman Sachs, warn that the market might be due for a selloff due to rapid gains and high valuations. However, a recent rally in lagging market segments like the Russell 2000 is sparking optimism for a rotation toward value stocks and cyclical sectors, potentially driving the next phase of the rally. The key question is whether this rotation will negatively impact the megacap stocks responsible for most of this year’s gains. Mike Dickson, head of research and product development at Horizon Investments, believes the market can continue rising even if tech stagnates, but not if it collapses. Both the S&P 500 and Dow Jones Industrial Average reached record highs on Tuesday, with the Nasdaq Composite achieving its second-highest close in history.

roadmap
DayTradeToWin Review

Mastering Market Entries: How to Use TradingView’s Roadmap Secrets

In the dynamic world of trading, having the right tools can significantly enhance your success. One such standout tool is the Roadmap Indicator, an institutional-level indicator offering unique market insights. This post will explore what the Roadmap Indicator is, how it functions, and how traders can leverage it for more informed decisions. What is the Roadmap Indicator? The Roadmap Indicator is designed to highlight institutional levels of interest within the market. Unlike widely accessible retail trading tools, the Roadmap is a sophisticated tool primarily used by institutional traders. It identifies key levels where major market players, such as hedge funds and investment banks, are likely to place their trades. How Does It Work? The primary function of the Roadmap Indicator is to show institutional levels of interest. These levels are crucial as they can indicate potential areas of support and resistance, where significant buying or selling activity is likely to occur. Here’s a brief overview of how it works: Trading with the Roadmap Indicator At Day Trade to Win, we utilize the Roadmap Indicator to make informed trading decisions. Our approach involves scalping within a five-point range for the following reasons: Timing Your Trades Timing is crucial when using the Roadmap Indicator. We generally enter the market around 10:00 a.m. Eastern Standard Time, as this period often coincides with market settling times, providing more predictable trading conditions. However, it’s essential to pay attention to the economic calendar, as high-impact news events can cause significant volatility. Economic Calendar Indicator To aid in this, we offer an economic calendar indicator for Ninja Trader and TradingView. This tool highlights upcoming high, medium, and low-impact events, allowing traders to avoid entering the market during potentially volatile periods. Practical Example Let’s consider an example. Suppose the market is showing a low at a particular point, and the Roadmap Indicator suggests an institutional level of interest. You would enter a trade around this level, aiming to exit once the market has moved approximately five points. If the market moves from a low to a high within this five-point range, you would exit the trade at or near the top of this range. Entry Strategies We use different entry strategies depending on market conditions: Conclusion The Roadmap Indicator is a powerful tool for traders looking to gain an edge by understanding and capitalizing on institutional levels of interest. By focusing on scalp trades within a five-point range and timing entries around key market periods, traders can enhance their strategies and improve their chances of success. For those interested in learning more, we offer live trading rooms and comprehensive training sessions to help traders master these techniques. Join us live every day in our trading room, and explore the wealth of resources we offer to help you become a successful trader. Visit daytradetowin to learn more and check out our range of tools and educational materials.

bullish
Market News

Rare Bullish Signal for Small-Cap Stocks from Options Traders

The demand for bullish call options linked to the Russell 2000 has soared, significantly outpacing the demand for bearish puts. This trend sends an optimistic signal to small-cap investors. Mandy Xu, head of derivatives-market intelligence at Cboe Global Markets, reports that recent sessions have seen a notable rise in call option demand tied to the Russell 2000 and its corresponding ETF. This surge has pushed these contracts to trade at a premium over bearish puts, suggesting that the small-cap rally could continue in the near term. Xu noted a similar pattern in late 2023, when investors boosted stocks expected to benefit from aggressive Federal Reserve interest rate cuts. At that time, the Russell 2000 rallied over 20% from early November to early December, outperforming the S&P 500 and the Nasdaq Composite, according to FactSet data. “We saw this in the fourth quarter last year when bullish sentiment in small caps hit an extreme, though ultimately, the trade faded as rate-cut bets were pared back. Will it be different this time?” Xu commented in an email. Call options grant traders the right to buy shares of the underlying stock or ETF at an agreed-upon price before they expire, while put options allow traders to sell. Option contracts tied to an index are usually settled in cash. On Thursday, trading volume for calls tied to both the Russell 2000 and the iShares Russell 2000 ETF (IWM) reached their highest levels in years, as reported by Dow Jones Market Data. Nearly 2.1 million calls tied to the ETF were traded that day, marking the highest daily turnover since December 2009 and the sixth-highest on record since 2005. Call options directly linked to the index saw their highest volume since 2021. Thursday also marked the Russell 2000’s best session since November. Small-cap stocks soared following a softer-than-expected inflation reading from the June CPI report, reviving expectations of a Federal Reserve interest rate cut in September. The Russell 2000 outperformed major indices like the S&P 500 and the Nasdaq, showing its most significant outperformance since March 2020 when the COVID-19 pandemic initially impacted global markets, according to Cboe data. Over the past four sessions, the Russell 2000 has gained 7.7%, on track for its best four-day streak since 2020, according to Dow Jones Market data. The index is poised to finish at its highest level since January 2022. Demand for bullish call options has remained elevated since Thursday. Trading volume in call options tied to the iShares ETF has been more than triple the daily average from the past two years on both Friday and Monday, according to market data. The call-put volume ratio, which compares activity in bullish calls to bearish puts, has also stayed above average. On Monday, the Russell 2000 was up 2.1% at 2,194, while the S&P 500 was up 0.1% at 5,619. The Nasdaq also saw a 0.1% increase to 18,415. Meanwhile, the Dow Jones Industrial Average (DJIA) was up 157 points, or 0.4%, at 40,281.

Autopilot
DayTradeToWin Review

Algo Trading Secrets: Maximize Profits with Successful Autopilot Trading

Welcome to today’s blog post, where we’ll dive into the Autopilot Trading System—an innovative automated trading tool designed to place trades for you and manage them efficiently. We’ll explore its features and settings to determine if it’s the right fit for your trading needs. Trading Disclaimer Before we begin, please remember that trading involves significant risk. Never trade with money you cannot afford to lose. What is the Autopilot Trading System? The Autopilot Trading System is an automated tool that simplifies the trading process by: Key Features 1. Break-Even Settings The break-even feature is essential for risk management, ensuring that once the market moves favorably by a set number of ticks, your stop loss adjusts to your entry point, protecting you from a loss. Example: 2. Trailing Stop A trailing stop follows the market price at a set distance, ensuring that as the market moves in your favor, your stop loss also moves to lock in profits. Example: Managing Your Trades Effective trade management is vital. The Autopilot Trading System offers several settings to help you manage your trades: Practical Examples Let’s look at some real-world scenarios demonstrating how the Autopilot Trading System operates: Benefits of Using the Autopilot Trading System Conclusion The Autopilot Trading System is a powerful tool for traders seeking to automate their strategy and manage risk effectively. If you’re interested in learning more or signing up for a free member account, visit DayTradeToWin. Members receive access to free information, indicators for NinjaTrader and TradingView, and much more. Happy trading, and remember to trade responsibly! For more details, check out the links in the description of this post. If you have any questions or need further information, feel free to reach out. Until next time, good trading!

Small Caps
Market News

Small Caps: The Hottest Investment Now

Futures indicate a positive start for equities, with the S&P 500 nearing a record high. Despite recent calm, analysts detect a significant shift in market sentiment. Greg Boutle of BNP Paribas notes that last Thursday’s softer-than-expected consumer price index report and the resulting dip in Treasury yields triggered a major rally in overlooked market segments. Small-cap stocks gained favor, while Big Tech faced heavy selling. Though this trend partially reversed on Friday, the key question is whether small caps will maintain their upward momentum. Tom Lee of Fundstrat is optimistic. He believes small caps, tracked by the iShares Russell 2000 ETF (IWM), present the “most compelling near-term investment case,” predicting a potential 50% gain in 2024. With small caps currently up only 6%, there is significant growth potential. Lee attributes this to the low June CPI, which he believes signals continued small-cap rallies. Lee’s optimism is based on five key factors: “We see the conditions for a strong rally in IWM. Mark Newton, head of technical strategy, believes a confirming ‘breakout’ of small caps could happen this week,” concludes Lee.

Scroll to Top