
- All Posts
- DayTradeToWin Review
- Futures Trading
- Market News
- NinjaTrader
- Price Action
- Prop Firm Trading
- Site
- Stock Trading
- Trading Mentorship
- Trading Software
- Trading Strategies
- TradingView

Introduction: A Structured Approach to TradingView Using TradingView effectively is not about loading as many indicators as possible. It’s about...
A Clean Sonic Monday Setup on the MES Some of the best trading lessons come from simple, repeatable setups. This...

A Real Example of Signal-Based Trading Across Multiple Markets In today’s session, we review how traders approached three different futures...
Adapting to Market Reversals in Real Time This session demonstrates how traders can transition from bullish to bearish positions within...
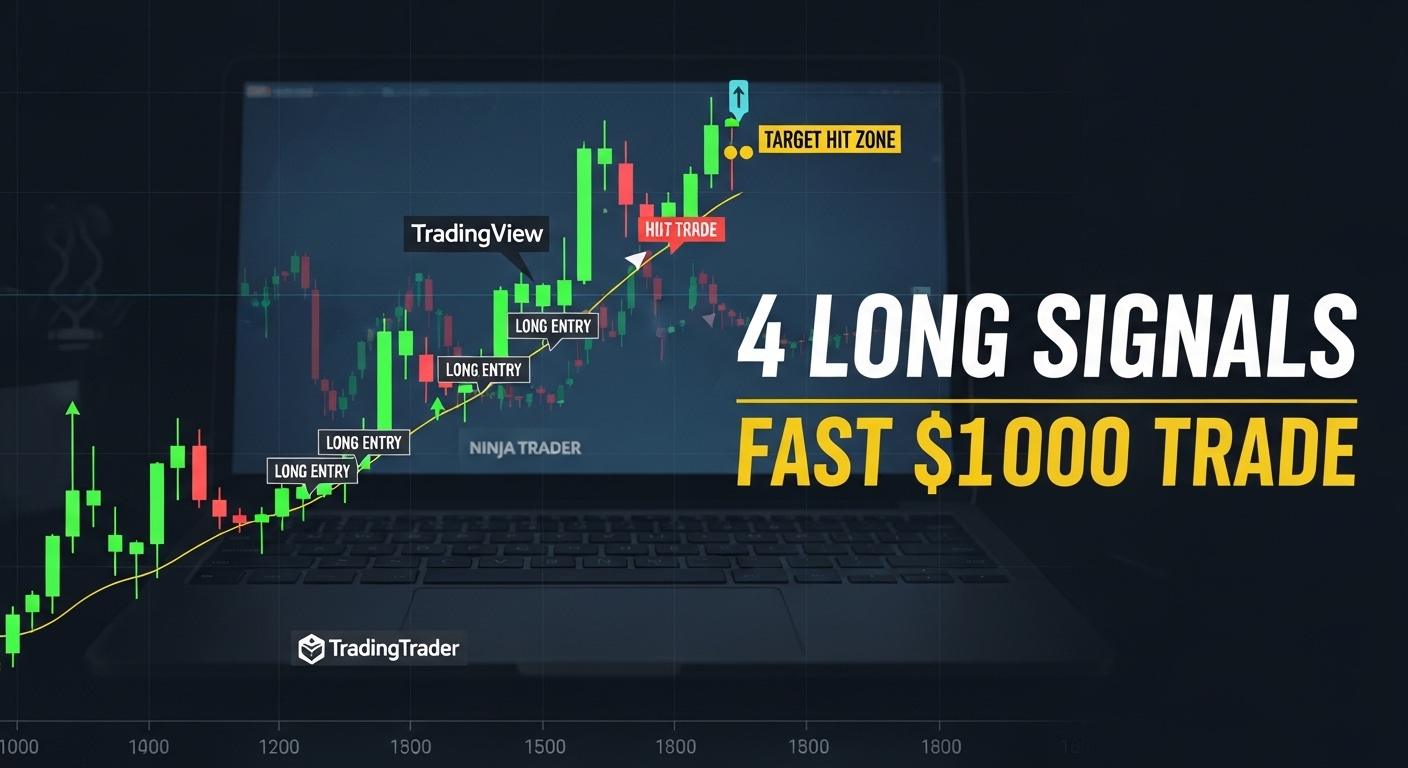
In today’s Sonic Monday session, we’re reviewing a real futures trade where patience and confirmation led to a fast $1,000...

Many traders spend hours in front of their screens searching for multiple opportunities throughout the day. However, not every trading...
Many traders believe success in trading comes from discovering a secret indicator or complicated system. However, experienced traders often focus...

The opening session of March 2026 began with widespread concern following weekend developments involving Iran. Many market participants anticipated downside...

During the latest live session, we examined how traders can use structured signal behavior to better judge whether market conditions...