
- All Posts
- DayTradeToWin Review
- Futures Trading
- Market News
- NinjaTrader
- Price Action
- Prop Firm Trading
- Site
- Stock Trading
- Trading Mentorship
- Trading Software
- Trading Strategies
- TradingView
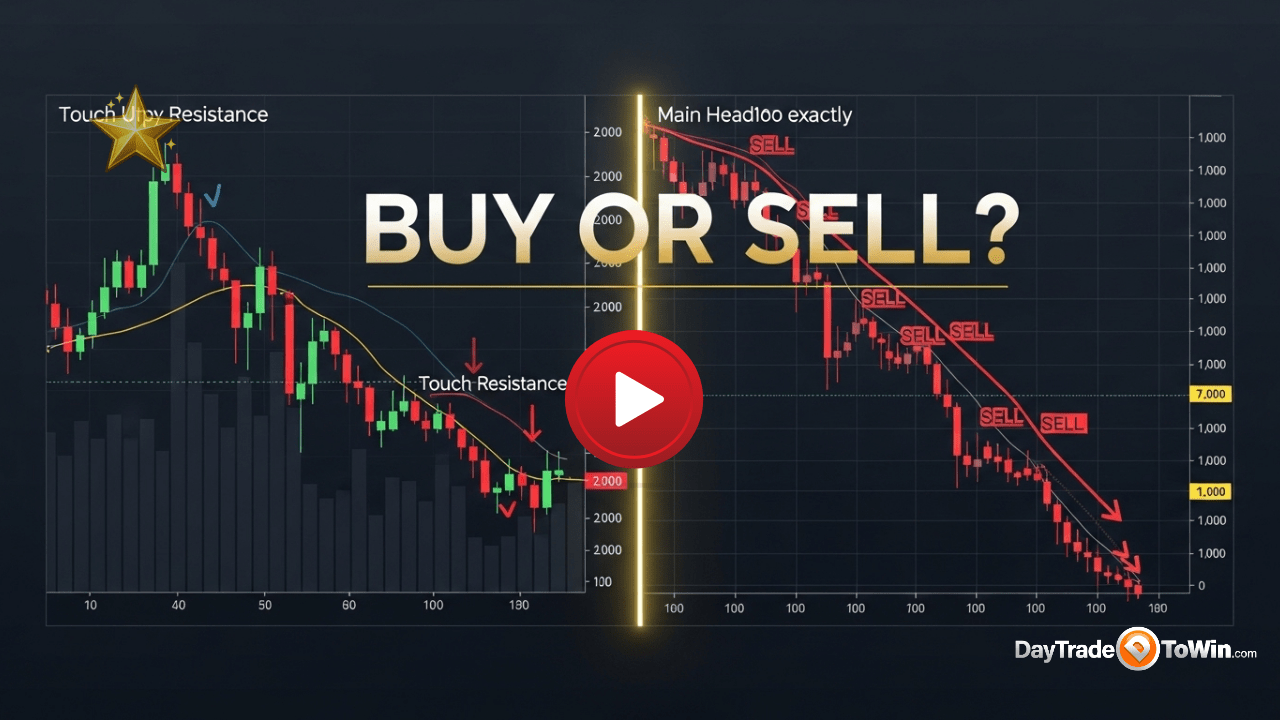
In this recent live session, the ES futures market approached a widely watched resistance zone and quickly revealed signs of...
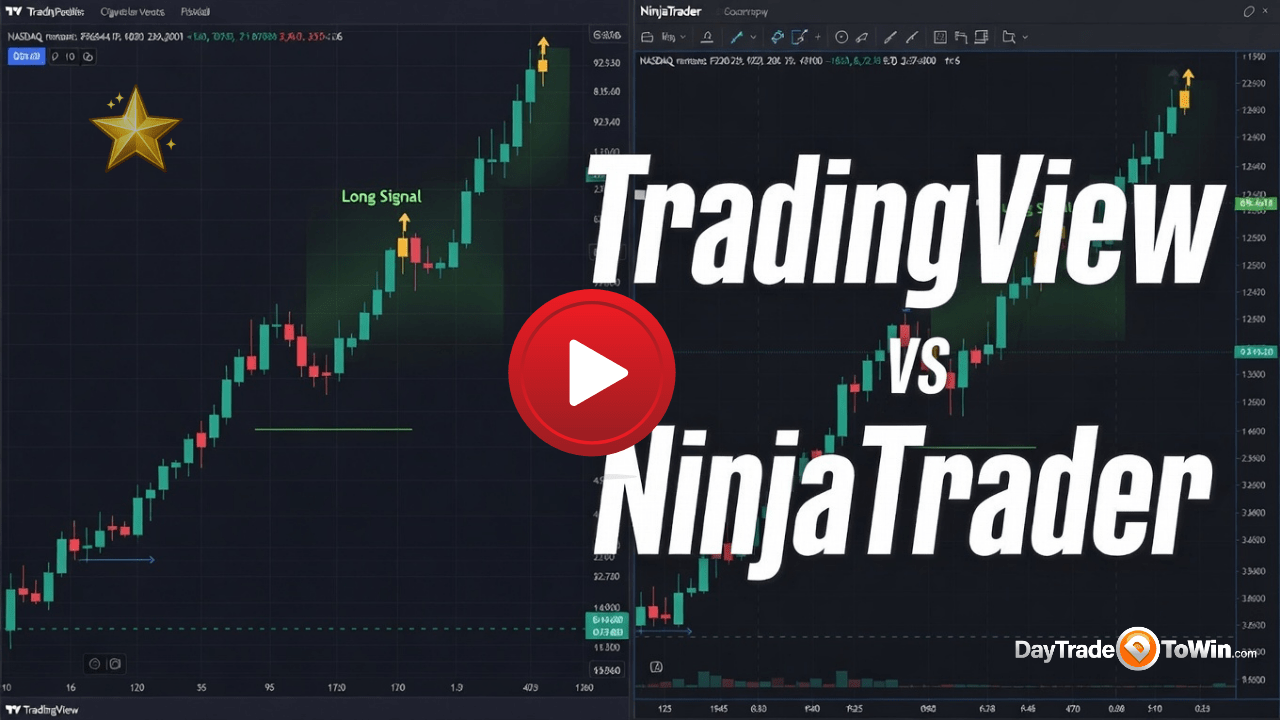
Traders frequently ask whether trading signals remain consistent when switching between platforms. Platform reliability is a major concern for futures...
Rapid market expansions often create the illusion that price will continue moving in the same direction indefinitely. In reality, strong...

An Educational Framework for Structured Futures Trading One of the most common challenges new traders face is determining trade direction...

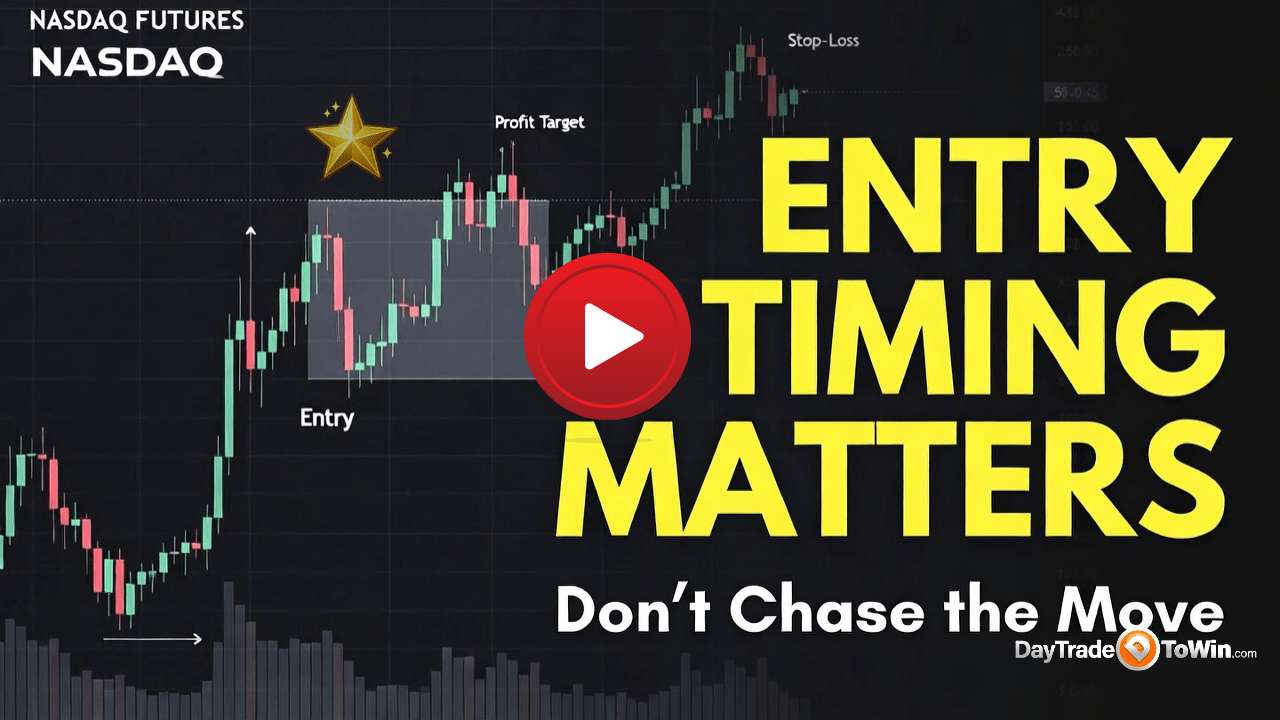
In day trading, direction is more important than prediction. On Tuesday, February 10, the market repeatedly tested a major price...

Understanding Support, Resistance, and Psychological Numbers On Monday’s market session, price action provided a textbook example of how markets behave...
Trading Downtrends the Right Way One of the biggest mistakes traders make during declining markets is trying to predict reversals...
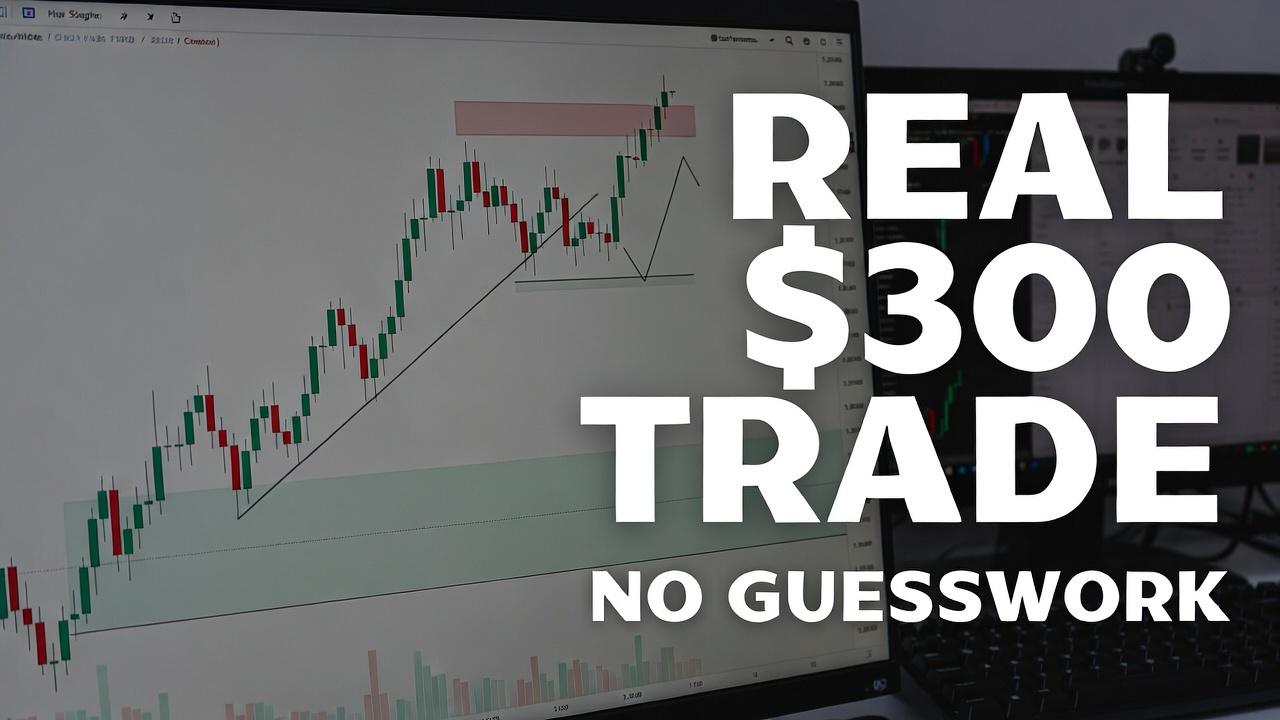
Live Trade Breakdown: How $300 Was Made in Minutes Using Price Action Confirmation In this article, I’m breaking down a...
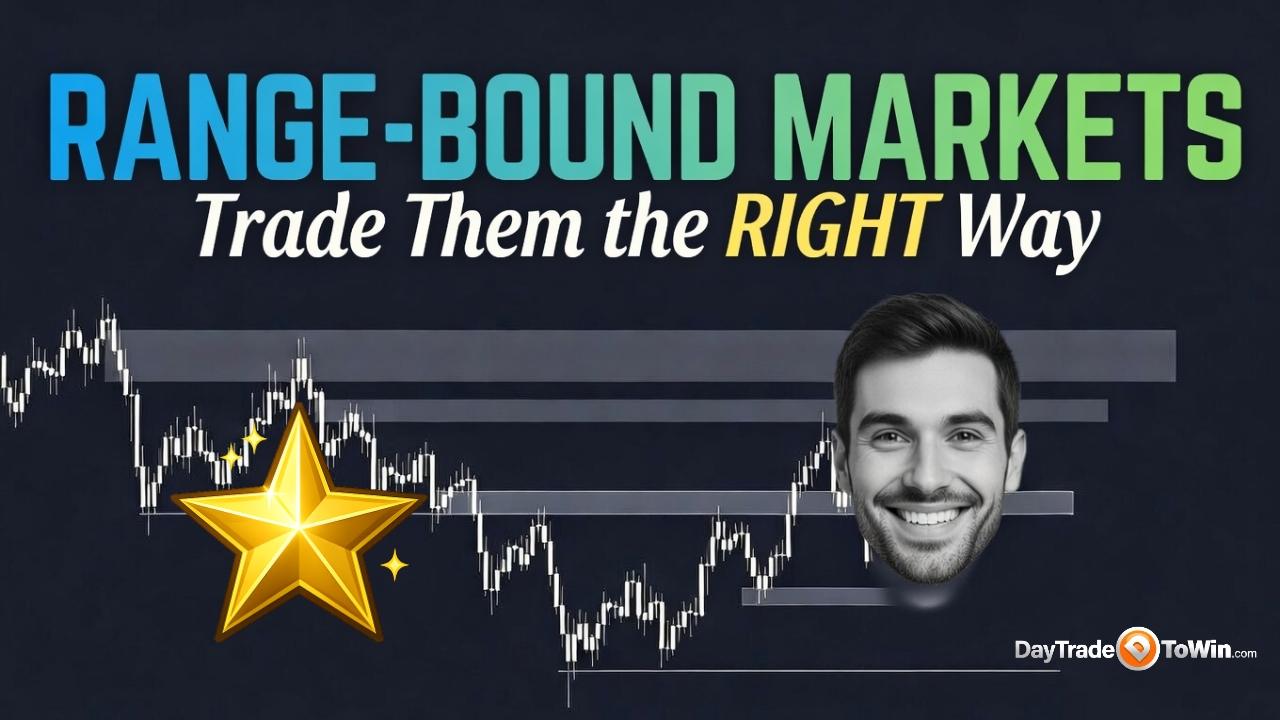
Sideways market conditions are where many traders struggle — not because trades don’t exist, but because expectations are misaligned. When...