Atlas Line Trading & ATO 2 Charts
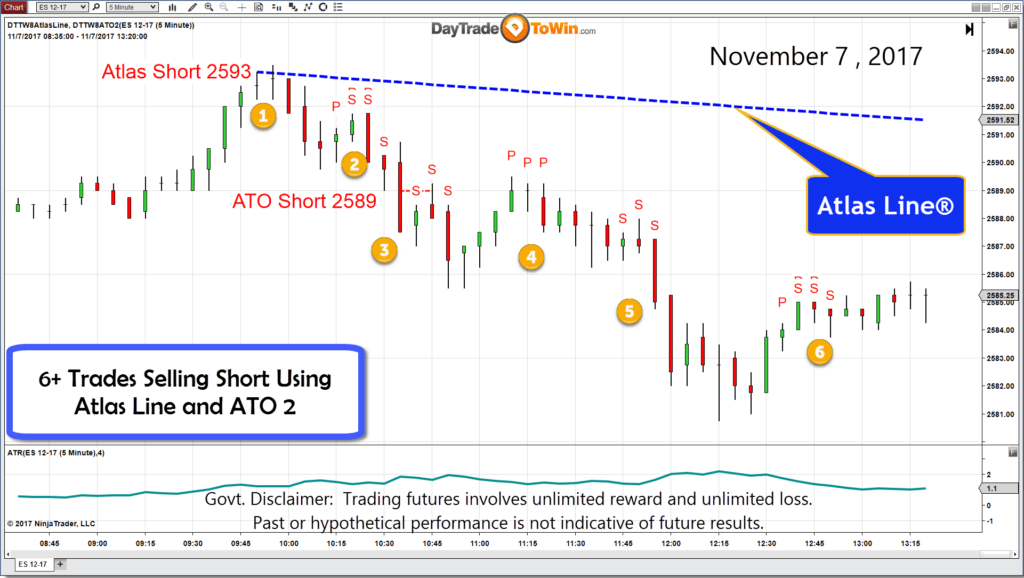
Here’s a chart of today’s E-mini S&P. Two products are displayed: the Atlas Line and ATO 2. In total, six trades occurred. Notice how the Atlas Line and ATO 2 “agreed” upon the short direction. How do you tell the two strategies apart? The Atlas Line trading consists of the blue dashed line, Atlas Short signal, and the small S and P signals. The ATO 2 consists of the ATO Short signal, the short dashed red line that points to the entry candle (in this image, it appears above and to the right of the number three). The blue/green line on the bottom is the ATR (Average True Range), which is a free indicator provided with most trading platforms.
Both strategies use the ATR to calculate the profit target and stop loss. These systems are not fully automated. The signals are automatically generated, but it’s up to you to manually place each trade and manage it according to the rules.
Atlas Line Trading Signals
Both of these strategies will start to produce signals soon after the market opens. For the E-mini, the time is 9:30 a.m. US/Eastern. As of Nov. 5, we are now in EST which is GMT-5. Just using these two systems together, you can probably get four or more trades per day. Keep in mind that you probably don’t want to take every trade. If market conditions are too slow, too fast, overbought, oversold, or a news event is about to come out, then it’s probably best you stay out until volatility returns to normal. In the afternoons, markets can go flat, which makes for choppy trading.
In the included live training, John Paul teaches you how to trade the methods in their entirety. Note the ATO 2 and Atlas Line are sold separately, but you can contact DayTradeToWin.com for a special discount.