Record-Breaking S&P 500, Yet Other Indexes Face Market Challenges
Thursday is poised to mark the fifth consecutive record close for the S&P 500, underscoring its sustained robust performance. Nevertheless, alternative metrics in the U.S. stock market paint a less sanguine picture. The Value Line Geometric Index (VALUG), an equal-weighted gauge monitoring the median performance of approximately 1,700 major listed companies in North America, significantly trails its November 2021 record highs—approximately 17% lower, as per FactSet data.

The contrast between the Value Line Geometric Index and the S&P 500, identified by the tickers VALUG and SPX, respectively, provides insightful observations. It illuminates how a select group of mega-cap technology stocks has been the driving force behind much of the S&P 500’s gains over the past year.
Steve Sosnick, Chief Market Strategist at Interactive Brokers, underscores that this discrepancy underscores the heightened concentration in large-cap stocks.
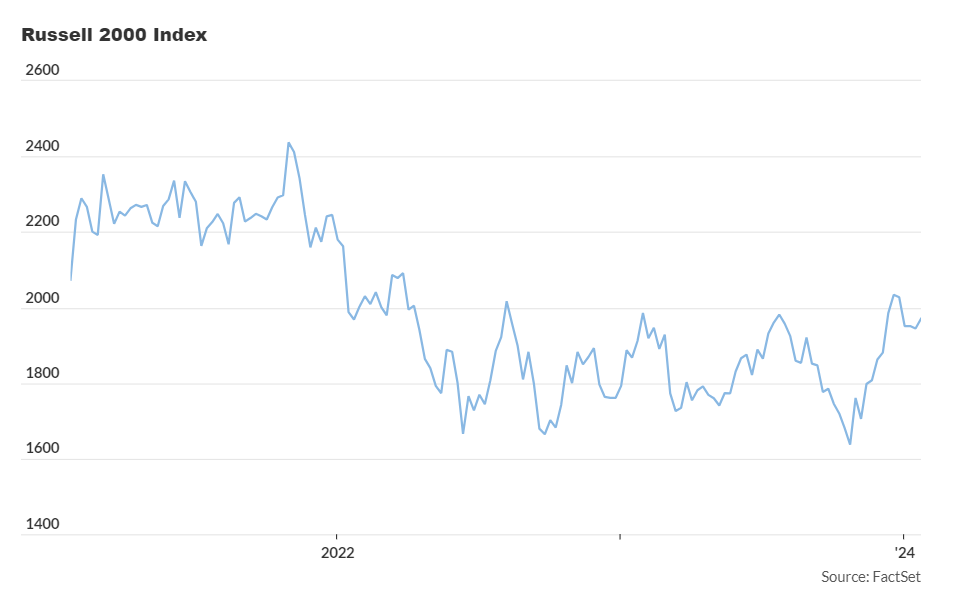
Further insights emerge from comparing the Russell 2000 index of small-cap stocks to the expansive Wilshire 5000, encompassing around 3,500 actively traded U.S. stocks.
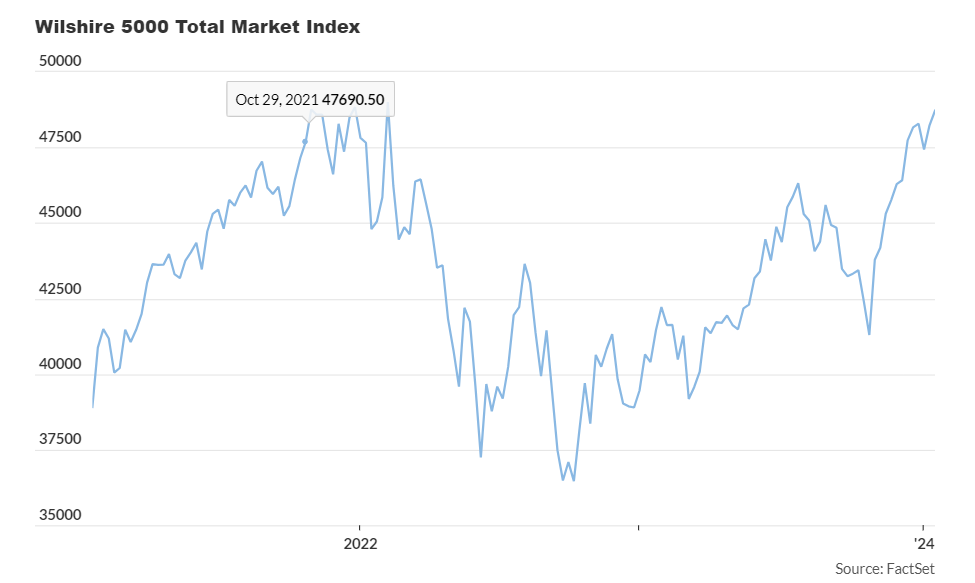
While the Wilshire 5000 hovers near its recent record high from January 3, 2022, the Russell 2000 lags by approximately 20% from its November 2021 record closing high. Sosnick emphasizes that this incongruity underscores the prevailing dynamic of small caps versus large caps in the market.
An examination of the S&P 500 growth index versus the S&P 500 value index reveals a recent resurgence by high-quality value stocks in catching up to the dominant tech sector. Over the past three months, the S&P 500 value index has experienced a rise of around 14%, slightly trailing the 17% increase in the S&P 500 growth-factor index.
However, the performance gap widens over the past 52 weeks, with a 29% gain for the S&P 500 growth index compared to a 13% gain for large-cap value stocks.
As of Thursday afternoon, the S&P 500 was up 0.2%, poised to conclude around 4,877 according to FactSet data.