trading strategies

DayTradeToWin Review

Unlocking Success: Precision Forecasting and Effective Price Action Swing Trading Strategies

Greetings, Fellow Traders! As we approach the dawn of 2024, it’s an opportune moment to contemplate the ever-changing landscape of trading and prepare ourselves for what lies ahead. Part 1: Trader Investment Tactics – Precision Forecasting In the initial installment of this blog series, we delved into the intricacies of forecasting through the potent lens of the January effect. This formidable tool has consistently proven itself as a reliable indicator for discerning market trends. Before we immerse ourselves in the promising possibilities of the coming year, let’s underscore the significance of responsible trading. It is crucial to trade only with funds that one can afford to lose. In the realm of market analysis, we navigated through the concluding weeks of December 2023 by scrutinizing prevailing market conditions. The Average True Range (ATR) became our guide in assessing volatility, a pivotal factor that molds our trading strategy and provides valuable insights into potential profit targets during market trends. Our exploration then shifted to the January effect, a phenomenon rooted in analyzing the market’s performance in January to forecast the overall trend for the year. By studying historical data from 2021, 2022, and 2023 for the S&P 500 and NASDAQ, we discerned how the direction in January often foreshadows the market’s trajectory for the entire year. The case studies underscored the reliability of the January effect – an upward month in January correlated with a bullish year, while a downward month hinted at a bearish trend. Armed with insights from this forecasting technique, we stand strategically poised for the opportunities and challenges that 2024 may present. Part 2: Price Action-Based Swing Trading Forecast Entry Method In the second part of our series, we delve into pragmatic strategies aimed at refining your trading acumen and capitalizing on market movements throughout 2024. Our focus shifts to the NASDAQ’s journey in 2023, highlighting key strategies to decipher market movements and leverage them for your benefit. Recognizing the establishment of a new high is pivotal, followed by a patient wait for a retracement before contemplating entry. The 50% retracement tool refines our entries, providing a more robust confirmation of the upward trend. We also delve into the significance of comprehending market psychology and utilizing phenomena such as the “Stochastic Pop” to our advantage. This strategy extends beyond the NASDAQ; it’s a versatile approach applicable across various markets, as briefly illustrated with the E-mini S&P. Exiting a trade is as crucial as entering, and we discuss strategic exit points based on market behavior. As we bid adieu to 2023, the insights garnered from market analysis serve as valuable instruments in navigating the intricacies of 2024. Stay tuned for upcoming updates and analyses as we embark on this exhilarating journey. Conclusion Trading is a continuously evolving art, and mastering market trends demands a blend of technical analysis, strategic patience, and a profound understanding of market psychology. May your trades be prosperous, and here’s to a triumphant 2024! Happy trading, everyone!

DayTradeToWin Review

Day Trading Future Analysis for 2022, 2023, & 2024

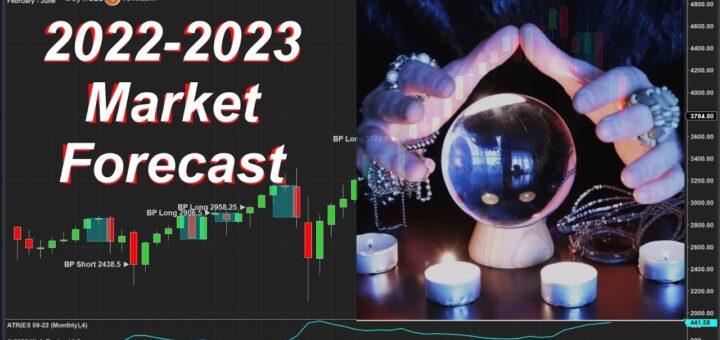
John Paul, the founder of DayTradeToWin, is in agreement with other financial analysis regarding expectations for the remainder of 2022 as well as the years 2023 and 2024. The first prediction or estimation is that 2022 price activity will continue descending while fluctuating. In other words, the expectation is a choppy gradual fall. He provides some key price points, and these are worth paying attention to. If those key points are hit, the expectation is that 2023 will end in all-time highs. An unprecedented buying opportunity could be underway. Such activity involves swing trading. Swing trading is when a trader holds a position longer-term than intraday. But when do you buy during this expected long-term bullish 2023 activity? John Paul’s suggestion is to follow the January effect, which calls for buying after price retraces 50% of the way back up to a prior high. The prediction for 2024 is that, overall, it will also be an up year. Why? Traditionally, election years are up years. Of course, you may wait for the January Effect to validate this expectation of the up year. You may find it beneficial to review the January Effect, as it describes how the month of January for each year has a history of exemplifying whether the entire year will be up or down as well as how to swing trade bullish retracements. DayTradeToWin offers many day trading methods. The focus is price action trading over other complicated or rigid methodologies. Price action focuses on what is right in front of you rather than advanced concepts or abstractions. For assessing volatility as well as determining the profit target and stop loss, the ATR (Average True Range) it utilized. With knowledge of how to use a signal and the related method, one can place and manage a trade. This includes placing the profit target, stop loss, and exiting as gracefully as possible if the fill has not happened within a given period or under other conditions.

DayTradeToWin Review

Day Trading School for Beginners and Pros Alike

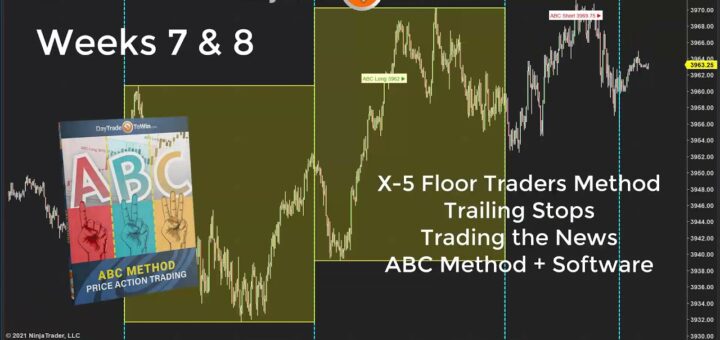
If you read our last post, you would have seen why the DayTradeToWin 8-Week Mentorship Program has been one-stop shopping for people who want to become pro day traders. This video goes even further, explaining what you’ll get (and learn) week by week. You’ll see signals for many of the methods. If you’ve been on the fence, this video may just convince you to enroll. New classes occur every month, so check out the official Mentorship page for the next class date and times. Week 1 focuses on the ATO 2 method. That will help you identify what is typically the first trade of the day. Week 2 uses a tick chart with a specific value to find Price Action Scalping opportunities. This method is exclusive to Mentorship, as it cannot be purchased standalone. Week 3’s Blueprint Method uses a 5-minute chart, typically. This is a universal price action trading method that focuses on a specific candle pattern. Week 4 moves you through everything that is the Trade Scalper. This method can be purchased standalone is highly popular. Week 5, you’ll be learning the Roadmap. For many, this is the most coveted of all the techniques taught in Mentorship. It is exclusive to Mentorship and can serve as a filter for all of the other methods. Week 6, the Atlas Line is added to your trading plan, offering yet another filter as well as a complete system to identify opportunities with signals. Week 7 & 8 are the final two weeks that teach the ABC, News, and other techniques. Review is incorporated. The focus is also to bring everything together in one complete plan. So, are you ready to change the way you trade forever? Mentorship is waiting. Take the leap that so many other traders have. It’s time to start winning and time to stop guessing and seeing patterns where there are none. May you find true success in your pursuits!

DayTradeToWin Review

Improve Your Trading – Target & Stop Strategy

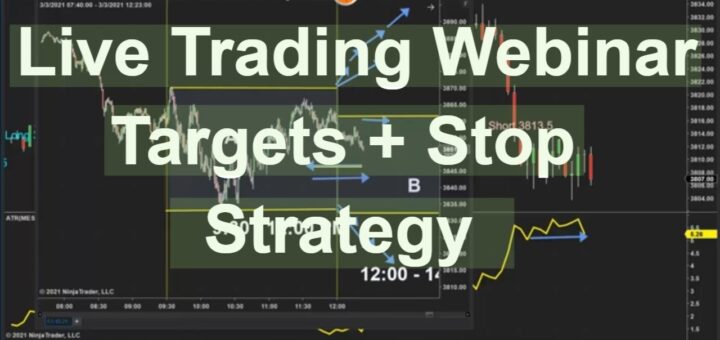
Successful day trading is all about making the correct decision at the right time. All it takes is too big or too low a value, sometimes just a tick, to throw off a trade and cause a loss. Rather than guessing these values, it is best to keep a consistent and flexible strategy. Otherwise, if you are random with guessing a value to use, how are you ever going to get an understanding of what works? You’ll be experimenting with random date. That’s a sure way for no progress To go a step further, one can argue that it is better to stick with a losing, but consistent approach with objective rules because at least you will be learning something on a consistent foundation. Of course, losing money is to be avoided as much as possible. This simply describes an aspect of the learning process. Watching this new video, you’ll see a great Long 3818 signal from the Trade Scalper software from DayTradeToWin. Scalping goes for small amounts many times per day with a quick in and out for each trade. The ATR (Average True Range) is used with a period value of four to determine the profit target and stop loss for each trade. This ensures only the last four bars are used in the calculation rather than the default value of 14 in NinjaTrader’s ATR indicator. In effect, you have a more recent sense of what the market can reasonably “do” in the moment if the last 20 or so minutes are considered (i.e. last four bars on a 5-Minute chart). In contrast, John Paul believes the default 14 value is far too great a duration for real-time applicability for guiding the profit target and stop loss. Note that on a 1-Minute chart, an ATR value of four would simply be four minutes, as each of the last four bars represents a minute of price moment. For some price action methods, when the ATR exceeds five points, it may be high time to switch to a 1-Minute chart, where the signals will likely still work and the profit and stop loss more reasonable for the average trader. John Paul shares a solid piece of advice, here. Use as much time as you need to simulate trading in a real-time environment. Use NinjaTrader’s Market Replay if you need to. Really get a sense of how the methods work in real-time. Observing historical price action with signals is good, but you need to see how and when those signals appear in relation to the candle and the sequence of action to be taken thereafter: trade placement and management, mainly. Once you see success per the trade performance reports, consider trading the Micro E-mini first. This way, the same price action of the regular E-mini is present, though the financial consequence is lessened. The Micros are less expensive to trade. You see, when real money is in play, some traders really struggle with the psychology of it all. This is why the more affordable Micros offer a set of training wheels before removing them and pedaling full force in the regular index futures with the rest of the trading world.

daytradetowin reviews
DayTradeToWin Review

Price Action Trading System – Roadmap

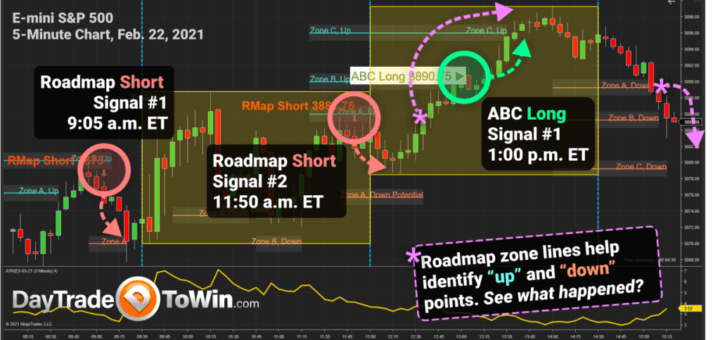
The chart below shows the Roadmap and ABC day trading methods from DayTradeToWin.com. Look at all those day trading signals. It’s a recent E-mini S&P 500 chart. If you work from left to right, you will see there is a “RMap Short” signal first. Soon after, the market moves down, indicating a winning signal. Some time goes by without any signal. However, we see some Zone ranges or boundary points in the down direction. Price never crossed these Zone lines. The meaning and significance of these license are taught in the included live training. The next signal is also a Roadmap short. We see price move upward, but if you stayed with the trade, it is possible that you could have been successful here as well. The next area you should pay keen attention to. Do you see those green/up Zone lines? There are three of them. Amidst them, there is an ABC Long. The ABC is a separate trading system. This means the Roadmap can help validate or confirm other systems because the Zone direction was also “looking up.” With this additional confirmation, you may feel more confident. The ABC long signal should have been a winner. Now here comes something even more interesting. There are no further Zone up or Down signals until later on. There are no further ABC signals until later on (not shown). You may get the sense the Roadmap is sort of intelligent in the way it behaves. Pull up the chart for yourself and you’ll see that these multiple Zone downs were really onto something that day! Remember, all of this is based on price action. There are known patterns among special circles in the day trading world. The Roadmap uses a certain set of key numbers in relation to common price action patterns. In a way, it can be used like the Atlas Line where you can get an understanding of where the market is expected to go throughout the day or at certain points. Then you can use the day trading system itself or use it with another technique in order to identify opportunities. However, make no mistake – the Atlas Line and Roadmap are completing different with how they calculate price action and produce signals. So, how does one get the Roadmap, ABC, and all of the rest? The eight-week Individual or Group Mentorship Program from DayTradeToWin.com is the only way. They have new classes that begin every month. They’ll teach you exact techniques for powerful price action trading.

DayTradeToWin Review

Advanced Trading Techniques & Tips for Beginners

Want to see recent Trade Scalper signals right away? Watch the first video, which is part of the “Advanced Techniques You Don’t Know” live webinar recording. Under normal E-mini S&P 500 market conditions, when the ATR (Average True Range) period value is set to four, the ATR should be between one and five points. If below one point, the market may be considered too slow. If above five points, the market may be too fast. Yes, it’s still possible to trade when markets are too fast. Take a look at other recent trading videos to see how that has been handled. A 5-Minute chart is often preferred because it presents a nice picture of price action. Traders use 10, 15, 30, and 60-Minute charts frequently. Using a smaller time frame that divides these greater time frames evenly allows traders to spot opportunities potentially missed at larger scales. At times, John Paul will use a daily chart to check recent highs and lows. By placing a Fibonacci tool with three areas defined: 0%, 50%, and 100%, this allows the identification of the midpoint (at 50%). When price exceeds the 50%, that can be used as confirmation to look for long trades intraday. Traders can then use trading systems like the Atlas Line, Trade Scalper, and ATO 2 to look for long signals that further confirm the anticipated price direction. If you are ever looking to measure distances or price between two points on the chart, use NinjaTrader 8’s ruler tool. Located in the drawing menu at the top of the chart (look for the pencil icon), the ruler is placed via three clicks. The first point or click defines the start. The next is the end point. And the last defines where the measurement is displayed (usually away from the candles). The ruler is easier than using the crosshair with mental math. Have you ever been in a trade to have price suddenly take off in another direction against you? Such activity may be caused by news events. Traders should heed scheduled financial news. A number of websites exist that present such events. However, it may be easier for you to use the free trading news indicator offered by DayTradeToWin.com. The indicator plots news events scheduled for the current week. Note that on Fridays, you may see few, if any news events. The indicator tends to refresh itself on Sundays or Mondays. Keep in mind that major non-scheduled events can still impact market activity. Overall, John Paul expects 2020 to be an up year for the E-mini S&P. Specifically, he provides a midpoint value of 2,782. With your own knowledge of trading risk and disclaimers, look for buying opportunities as presented in the video. Want to learn more? Enroll in the next eight-week Mentorship Program. All courses and software are included with Lifetime Licenses.

Scroll to Top