Analysts at Ned Davis Research issued a prudent warning on Wednesday, advising buoyant stock-market enthusiasts to temper their expectations of a “Santa Claus rally.” The indicators measuring bullish sentiment have surged into the “excessive” zone, a potential signal that runs parallel to the historical trend of a lackluster performance in the stock market during the initial half of December, according to insights from Ed Clissold, Chief U.S. Strategist, and London Stockton, Research Analyst.
The Short-Term NDR Daily Trading Sentiment Composite, incorporating over 20 indicators including the Cboe Volatility Index (VIX) and various trader polls, recently scaled to its most optimistic level since July 25, maintaining an optimistic 76.7, they highlighted. Additionally, NDR’s crowd sentiment poll, characterized by a more intermediate-term perspective, marked its return to optimistic territory for the first time since August.
This wave of positive sentiment follows the S&P 500’s remarkable 8.9% surge in November, standing as its most substantial monthly gain since July 2022 and the sixth-best November performance dating back to 1926. The analysts attribute November’s market gains to a retreat in the benchmark 10-year Treasury yield from its October peak of 5%. However, the upswing in sentiment levels, signaling a potential market pullback, aligns seamlessly with the historical tendency for weakness in the stock market during the initial stages of December.
Clissold and Stockton underscored the likelihood of this weakness catching investors off guard, particularly those anticipating robust stock-market performance in November and December—historically recognized as the market’s strongest back-to-back months.
The anticipation surrounding the “Santa Claus” rally was identified as a contributing factor to this sentiment. The analysts acknowledged the term’s loose application on Wall Street, drawing a comparison to shoppers bemoaning premature Christmas decorations in stores.
While the term traditionally refers to the market’s inclination to ascend in the final five trading days of the calendar year and the first two trading days of the subsequent year, Clissold and Stockton highlighted the interpretative variability.
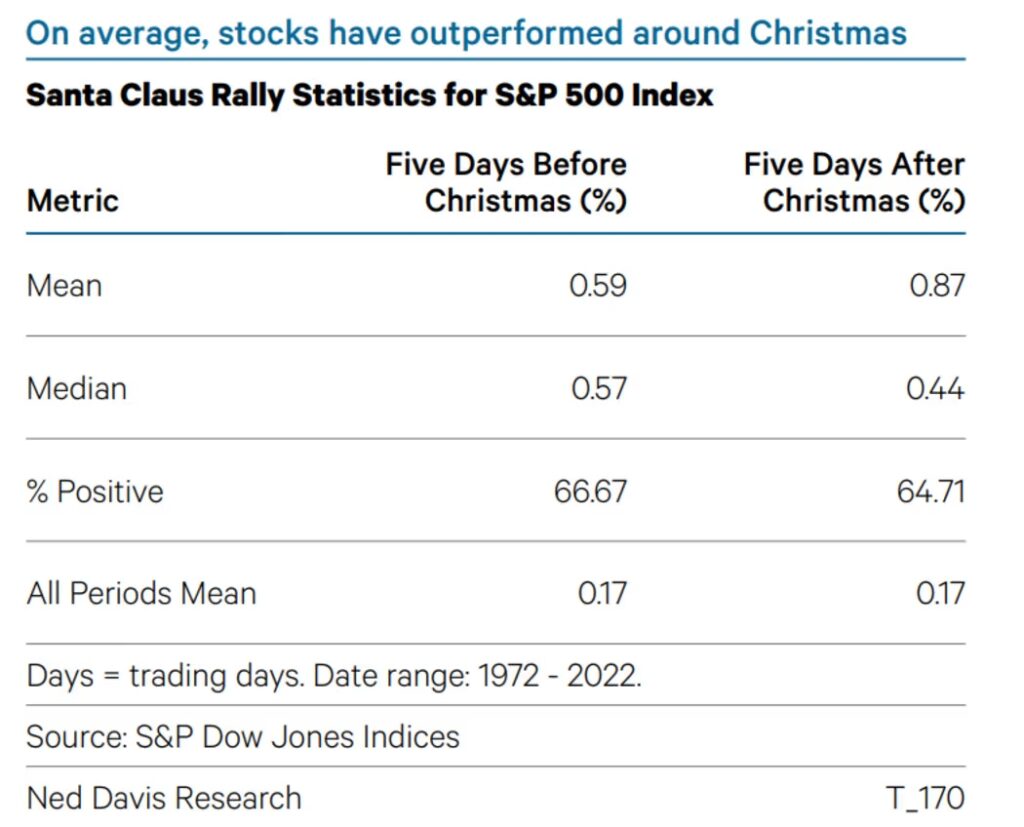
They presented historical data revealing the S&P 500’s average gains of 0.59% in the five days preceding Christmas and 0.87% in the five days following, compared to a 0.17% average gain for all five-day periods since 1972.
In a cautiously optimistic tone, the analysts suggested that a seasonal pullback, alleviating short-term optimism, could potentially lay the groundwork for a genuine Santa Claus rally during the holiday season.
John Paul is the founder of DayTradeToWin, a trading education and software company established in 2008, supporting traders worldwide. His expertise focuses on price action-based futures trading strategies and structured market analysis.
DayTradeToWin delivers trading education, indicators, and software tools designed to help traders apply disciplined, rule-based decision-making across global futures markets.
He is the creator of multiple trading methodologies, including the Sonic System, Atlas Line, and Trade Scalper, which help traders identify structured opportunities in markets such as the E-mini S&P 500 (ES), Nasdaq (NQ), crude oil (CL), and gold (GC).
Official website: https://daytradetowin.com