Major U.S. equity indexes appear to be on a consistent upward trajectory, but individual stocks within these indexes tell a different story.
A report from Charles Schwab & Co. highlights the disparity between the relatively steady performance of overall equity indexes and the volatile behavior of their constituent stocks. Despite the S&P 500 hitting record highs in 2024, the average stock within the index has shown significant swings.
According to Kevin Gordon, a senior investment strategist at Schwab, this divergence is unusual for typical bull markets, signaling a unique market cycle. Liz Ann Sonders, another strategist at Schwab, likened the current market to a duck: seemingly calm on the surface but characterized by frenetic activity underneath.
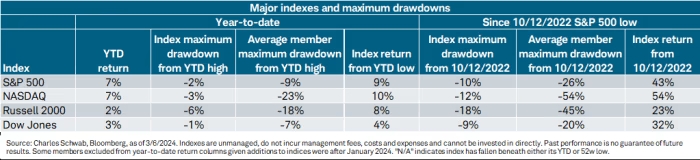
This gap is particularly notable in the Nasdaq Composite, where the index itself has experienced minimal downturns while individual Nasdaq stocks have seen substantial declines.
This trend persists when analyzing performance since the start of the bull market in October 2022. Despite the S&P 500’s impressive 43% increase during this period, the average index stock has faced a 26% pullback.
Similar patterns emerge in indices like the Russell 2000 and the Dow Jones Industrial Average.
Gordon suggests that this volatility gap between indexes and individual stocks highlights an imbalanced market, where the outstanding performance of a few stocks masks the weaker performance of many others. Roughly half of S&P 500 constituents are trading below their January 2022 levels, an unusually high number for this stage of a bull market.
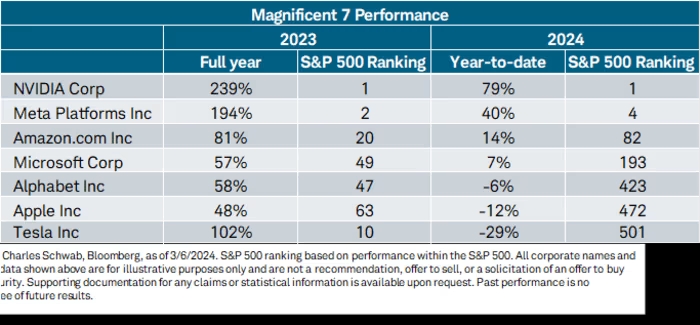
However, investors tracking index funds have benefited from the exceptional performance of a select few mega-cap stocks, which have more than compensated for broader weakness. These stocks, dubbed the “Magnificent Seven,” including Nvidia, Microsoft, Apple, Amazon, Meta, Alphabet, and Tesla, have been instrumental in driving the S&P 500’s gains.
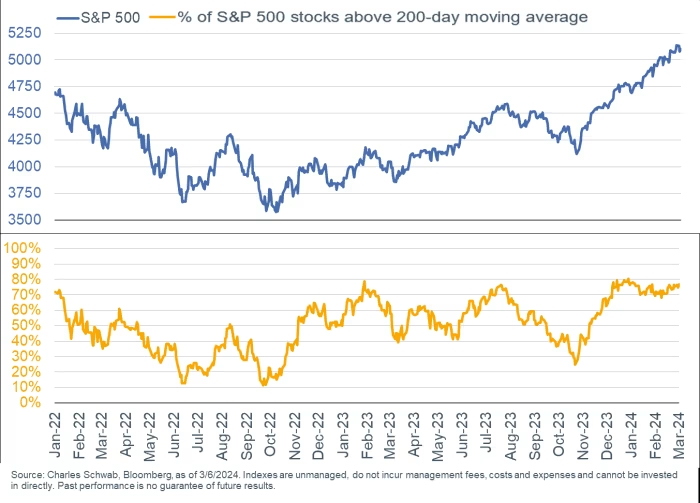
While market breadth has shown recent improvements, indicating more individual stocks participating in the rally, it hasn’t been a linear progression. The proportion of stocks trading above their long-term averages has risen since the start of the year but remains below peak levels seen in December.
John Paul is the founder of DayTradeToWin, a trading education and software company established in 2008, supporting traders worldwide. His expertise focuses on price action-based futures trading strategies and structured market analysis.
DayTradeToWin delivers trading education, indicators, and software tools designed to help traders apply disciplined, rule-based decision-making across global futures markets.
He is the creator of multiple trading methodologies, including the Sonic System, Atlas Line, and Trade Scalper, which help traders identify structured opportunities in markets such as the E-mini S&P 500 (ES), Nasdaq (NQ), crude oil (CL), and gold (GC).
Official website: https://daytradetowin.com