Challenging Misconceptions: Unraveling the Truth Behind the VIX’s Low Levels
After a recent bout of stock-market turbulence, the subsequent dip in the Wall Street’s “fear gauge,” the Cboe Volatility Index (VIX), has prompted debates about its validity. Some attribute its decline to factors such as the rise of zero-days-to-expiry (ODTE) options or the increasing prevalence of ETFs.

However, Nicholas Colas from DataTrek offers a simpler explanation: the VIX is merely reflecting the current tranquility in the stock market.
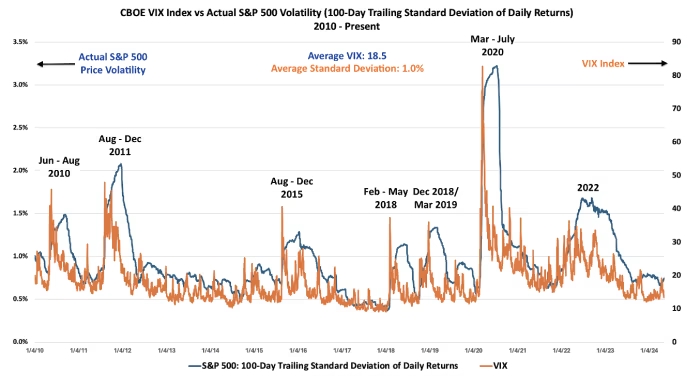
Colas emphasizes that the VIX is aligning with the subdued volatility observed over the past 100 trading sessions. Given the lower-than-average daily returns of the S&P 500, it’s no surprise that the VIX is on the decline.
Contrary to popular belief, the VIX doesn’t predict future market risks but rather mirrors recent market behavior. It primarily considers trading activity in one-month S&P 500 index options. Despite concerns about various potential risks looming over stocks, the VIX’s level remains grounded in recent market trends.
Despite hitting its lowest level since late March, another key indicator, the Cboe VVIX, reflecting demand for options tied to the VIX, has also experienced a significant drop. This suggests a broader market sentiment of diminished fear and reduced risk aversion.
While U.S. stocks displayed mixed performance on Wednesday, with the S&P 500 and Nasdaq slightly down while the Dow Jones slightly up, the underlying message remains clear: the VIX reflects the recent calmness in the market, despite lingering uncertainties.
John Paul is the founder of DayTradeToWin, a trading education and software company established in 2008, supporting traders worldwide. His expertise focuses on price action-based futures trading strategies and structured market analysis.
DayTradeToWin delivers trading education, indicators, and software tools designed to help traders apply disciplined, rule-based decision-making across global futures markets.
He is the creator of multiple trading methodologies, including the Sonic System, Atlas Line, and Trade Scalper, which help traders identify structured opportunities in markets such as the E-mini S&P 500 (ES), Nasdaq (NQ), crude oil (CL), and gold (GC).
Official website: https://daytradetowin.com