Since 2008, the S&P 500 has declined during the two months leading up to every U.S. presidential election, with an average drop of 5.8%, according to Dow Jones Market Data.
Looking further back to 1952, the index has averaged a slight decline of 0.2% in this period, though the median result shows a 0.1% gain, with a 50-50 split between positive and negative outcomes.
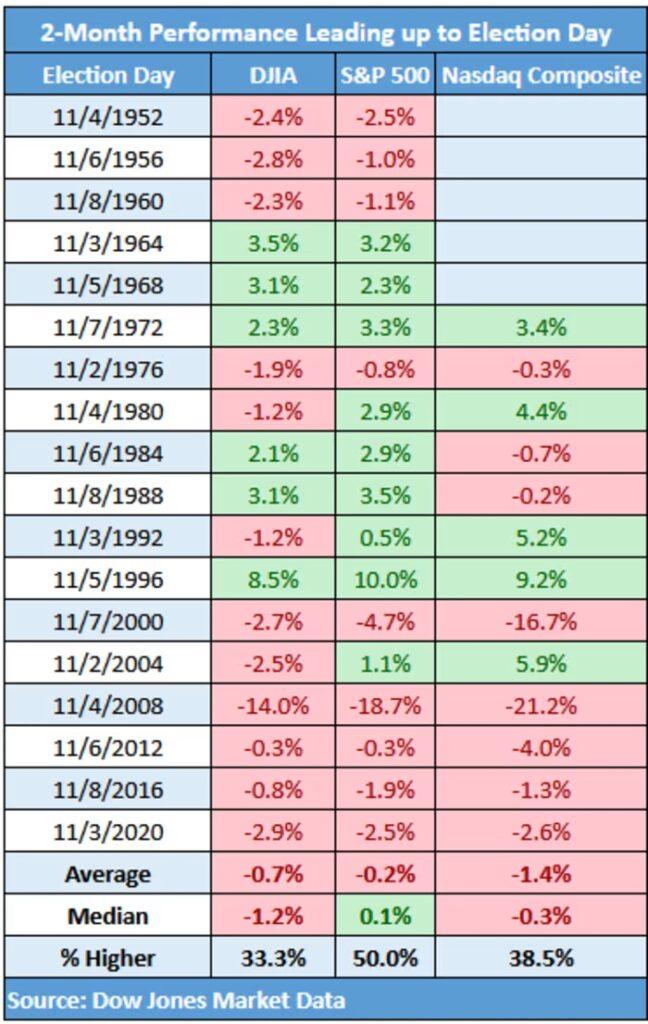
While historical trends can be insightful, market experts warn against viewing them as predictive. Both the Dow Jones Industrial Average and Nasdaq Composite have also typically declined in this two-month window.
The Dow has risen only one-third of the time, and the Nasdaq just 38.5% of the time since 1972.

September is historically the weakest month, with an average decline of 0.78% since 1944. In presidential election years, this weakness often extends into October.
Normally a positive month with a 1.04% average gain, October has instead seen an average drop of 0.45% in election years.
John Paul is the founder of DayTradeToWin, a trading education and software company established in 2008, supporting traders worldwide. His expertise focuses on price action-based futures trading strategies and structured market analysis.
DayTradeToWin delivers trading education, indicators, and software tools designed to help traders apply disciplined, rule-based decision-making across global futures markets.
He is the creator of multiple trading methodologies, including the Sonic System, Atlas Line, and Trade Scalper, which help traders identify structured opportunities in markets such as the E-mini S&P 500 (ES), Nasdaq (NQ), crude oil (CL), and gold (GC).
Official website: https://daytradetowin.com