Using Tick Charts to Trade the AutoPilot Trading System
The AutoPilot Trading System is a powerful tool that can help you navigate the fast-paced world of trading. By incorporating Tick Charts into your trading strategy, you can gain a deeper understanding of market trends and make more informed decisions.
What are Tick Charts?
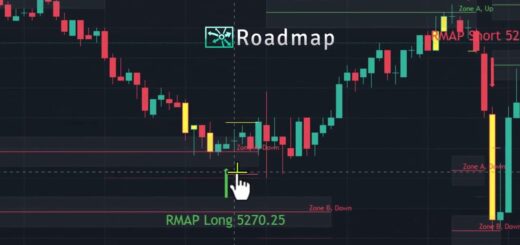
Tick Charts are a type of chart that represents a specific number of transactions, or “ticks,” rather than a fixed time interval. This means that each bar on the chart represents a certain number of trades, allowing you to see the market’s activity and volatility more accurately than with traditional time-based charts.
Trading with AutoPilot and Tick Charts
To demonstrate the power of combining Tick Charts with the AutoPilot Trading System, let’s walk through a trading scenario. We’ll start trading at 10:15 ET to avoid any potential news events that could impact the market.
- Step 1: Set up the AutoPilot Trading System
- Step 2: Configure the Tick Chart
- Step 3: Turn on the AutoPilot Trading System
- Step 4: Monitor the Trades
- Step 5: Evaluate the Result
Incorporating Tick Charts into your AutoPilot Trading System strategy can provide valuable insights into market activity and help you make more informed trading decisions. By starting your trading session at 10:15 ET and using a 100 Tick Chart with the E-mini S&P futures contract, you can maximize the potential of the AutoPilot Trading System and improve your overall trading performance.