
Bulls Beware: Why the S&P 500’s Support Break Could Spell Trouble
The S&P 500 Index (SPX) reached a peak near 4600 in late July, marking the start of a downtrend that persists. Recently, it faced a significant test of support around 4330, and this support held firmly. According to this measure, the bull market remains intact on the SPX chart. While there is another support level at 4200, it’s the 4330 level that is crucial for maintaining a “core” bullish stance.
Despite several instances of oversold conditions, the ongoing rally could be categorized as an oversold bounce. Typically, such rallies tend to reach or slightly surpass the declining 20-day Moving Average before fading. With NVIDIA’s robust earnings reported on Wednesday, SPX is likely to surpass its declining 20-day Moving Average on Thursday.
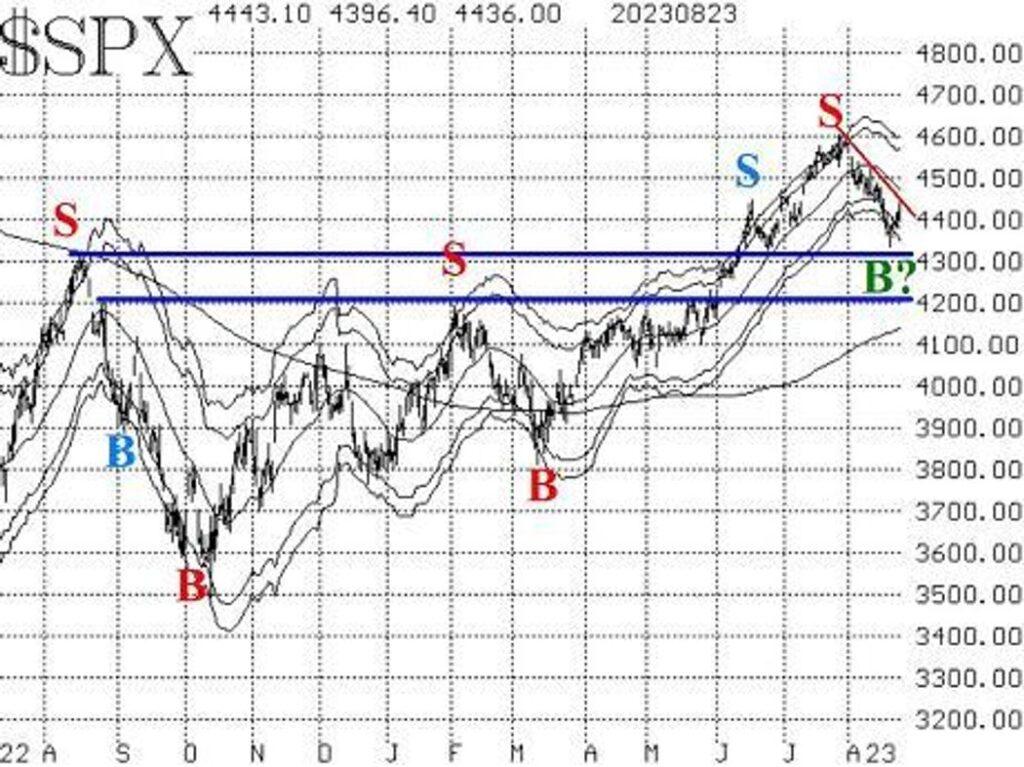
During the recent pullback, SPX dipped below its -4σ “modified Bollinger Band” (mBB), which completed the McMillan Volatility Band (MVB) sell signal from late July (indicated by a red “S” on the SPX chart). Furthermore, moving below the -4σ Band may set the stage for a potential new MVB buy signal. Although a “classic” mBB buy signal appeared recently in SPX’s activity, these signals have often produced false alarms in the past. Therefore, confirmation through follow-through, culminating in the MVB buy signal, is awaited and could materialize shortly.
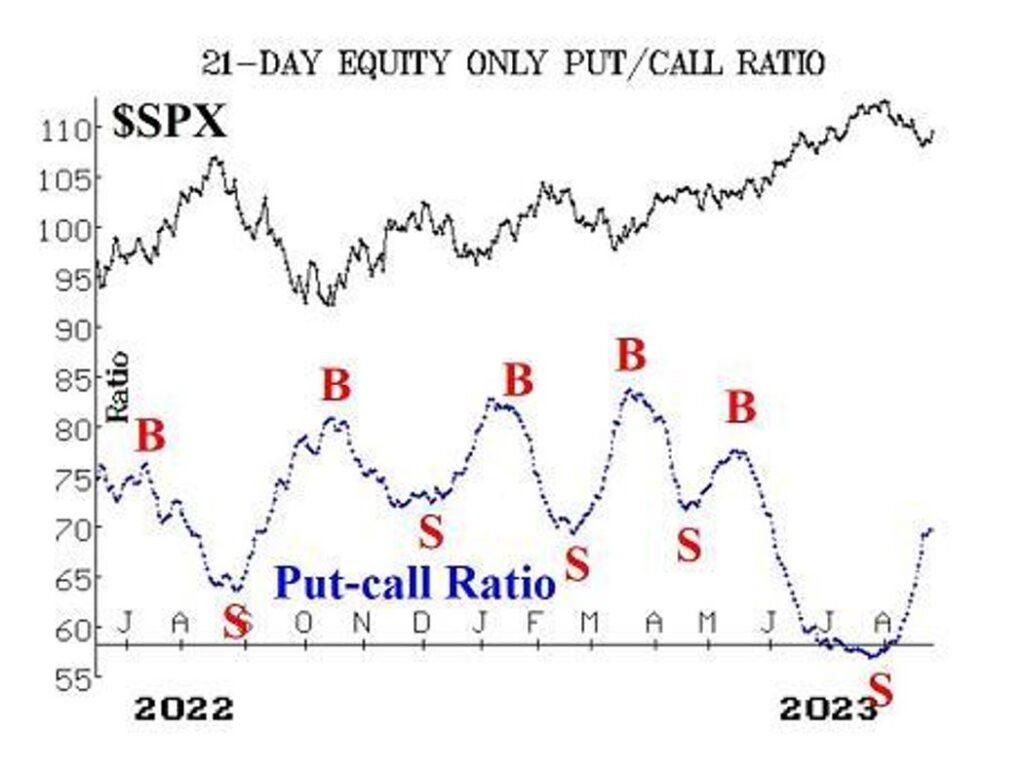
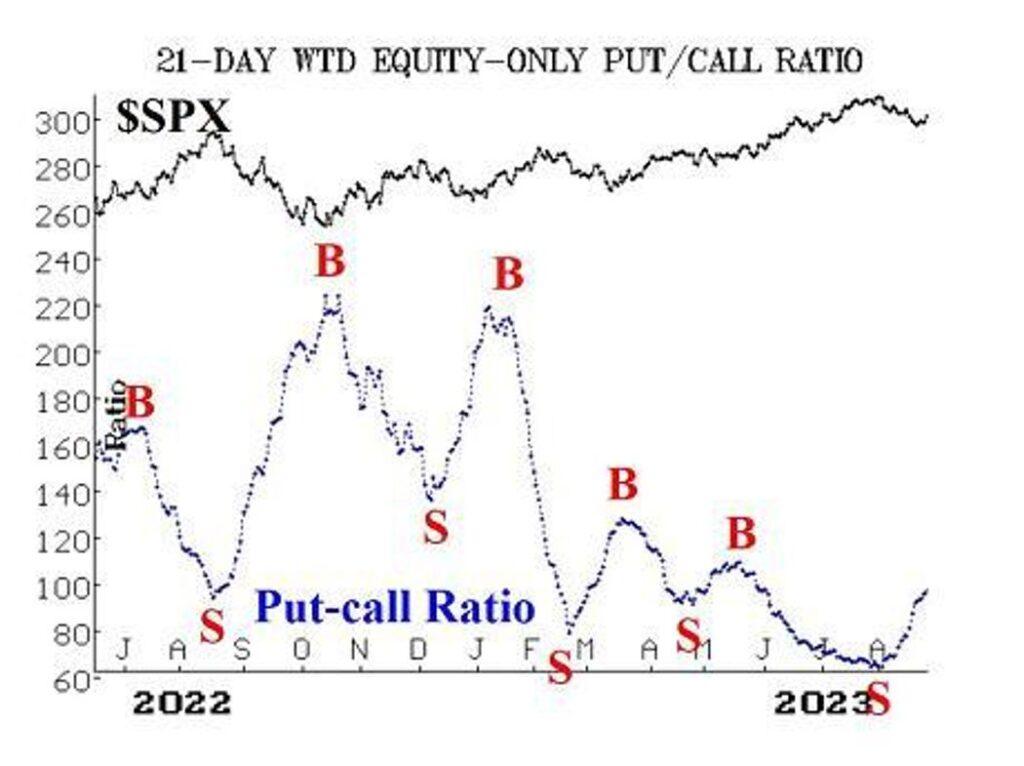
Equity-only put-call ratios continue to climb, maintaining their sell signals until they reverse and start descending. Interestingly, even during market rallies, significant put buying persists, contributing to the elevation of these ratios.
Throughout most of August, market breadth has been weak, causing breadth oscillators to sustain sell signals. Despite reaching deeply oversold conditions, it requires at least two days of positive breadth to transition them from this state to a buy signal – a condition that hasn’t yet been met.
Over the past eight trading days, New 52-week Lows on the NYSE have outpaced New Highs. While this nullified the long-standing buy signal from this indicator, it now stands neutral. A sell signal necessitates New Lows exceeding 100 issues for two consecutive days. Despite the recent surge in New Lows, it hasn’t been sufficient to trigger a sell signal.
These indicators, often referred to as “market internals,” align with SPX’s decline, reflecting predominantly negative sentiment. In contrast, volatility metrics have largely remained subdued, reflecting a bullish outlook for stocks. The “spike peak” buy signal from VIX a few weeks ago still holds, alongside the persistence of the intermediate-term trend of the VIX buy signal. This latter signal would be invalidated if VIX closes above its declining 200-day Moving Average – a level it briefly touched this week.
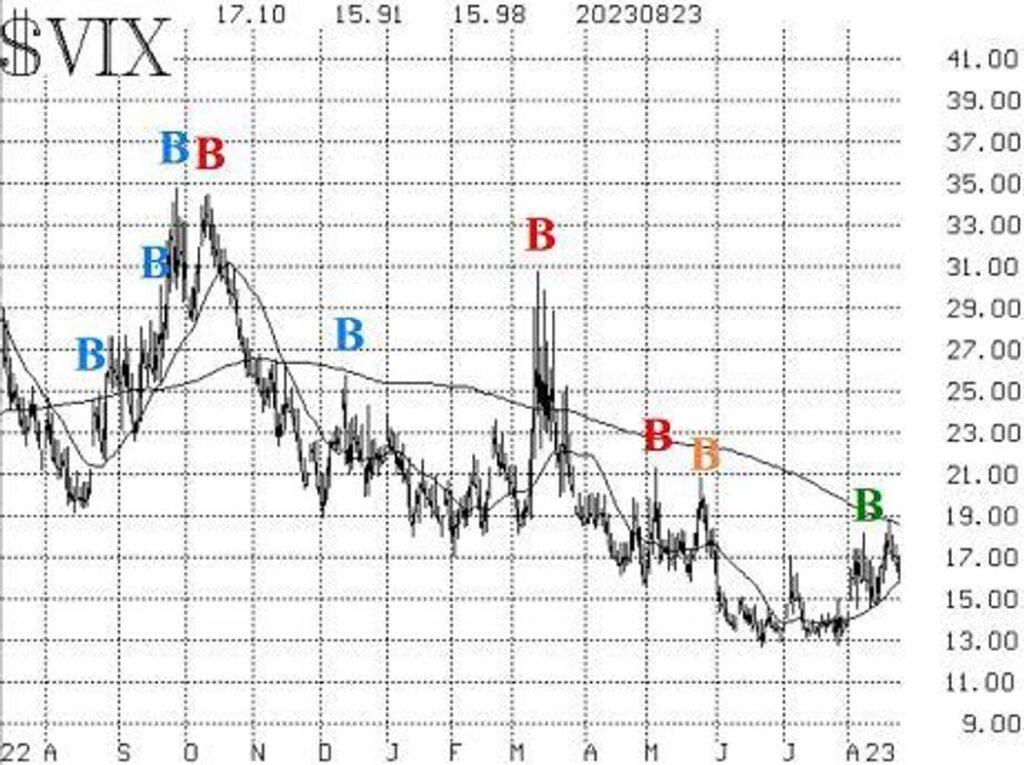
Volatility derivatives, in terms of the upward-sloping term structures of VIX futures and CBOE Volatility Indices, retain their bullish disposition. Moreover, VIX futures trade at substantial premiums compared to VIX.
Hence, we’re maintaining a low-delta “core” bullish position as long as SPX remains above 4330, while making trading decisions based on other indicators.
SPX has moved above its -3σ Band, triggering a “classic” modified Bollinger Band buy signal. However, for a McMillan Volatility Band (MVB) buy signal to materialize, SPX would need to reach 4459 or higher.
If SPX trades at 4459 at any point, consider buying 1 SPY Oct (20th) at-the-money call and selling 1 SPY Oct (20th) call with a striking price 18 points higher.
To manage the relatively higher cost of these October options, we’re using a bull spread. This signal holds unless SPX closes below its -4σ Band, which would negate the signal. The trade aims for SPX to touch the +4σ Band.
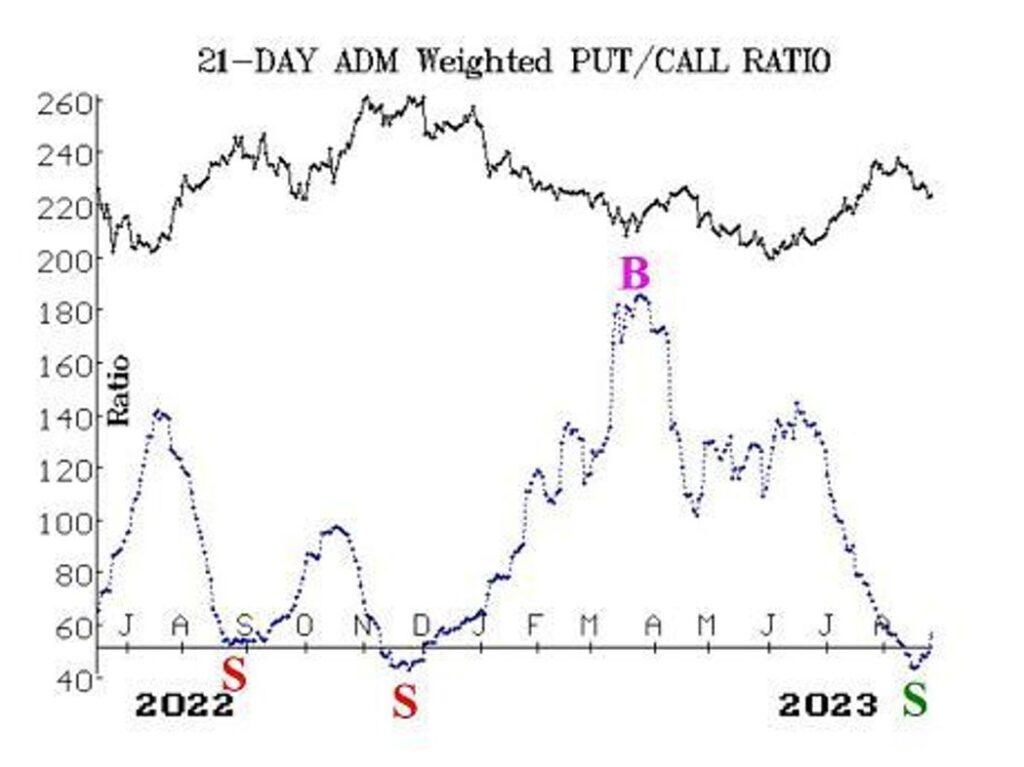
New Recommendation: Archer-Daniels-Midland (ADM)
A recent weighted put-call ratio sell signal has emerged for ADM. Since the stock fell below support, we’re acting on this signal.
Consider buying 3 ADM Oct (20th) 82.5 puts in line with the market.
ADM: 81.16 Oct (20th) 82.5 put: 3.00 bid, offered at 3.20
Follow-up action: All stops are mental closing stops unless otherwise noted.
For SPY spreads, we’re following a “standard” rolling procedure: if the underlying hits the short strike in any vertical bull or bear spread, roll the entire spread. Maintain the same expiration and retain the distance between strikes unless instructed otherwise.
- The 800-share stock position in KOPN was stopped out on August 11th.
- The “core” bullish position of 2 SPY Sept (15th) 456 calls has been rolled multiple times with a 6-point in-the-money threshold.
- The 10 VTRS Sept (15th) 10 calls should be rolled up and out to VTRS Sept (15th) 11 calls. The stop remains at 10.75.
- Maintain the 8 CRON Sept (15th) 2 calls without a stop while takeover rumors unfold.
- Hold the 6 ORIC Sept (15th) 7.5 calls while the stock remains strong. The stop remains at 8.10.
- Keep the 2 EW Sept (15th) 77.5 puts as long as the weighted put-call ratio remains on a sell signal.
- The 4 SPY Sept (29th) 480 calls align with the CVB buy signal. Hold these calls with a striking price equal to SPY’s all-time high.
- Sell the 5 EEM Oct (20th) 41 calls since the EEM weighted put-call ratio is no longer on a buy signal.
- For the position of 1 SPY Sept (15th) 448 put and Short 1 SPY Sept (15th) 418 put, exit if either equity-only put-call ratio shifts to a new buy signal.
- Hold the 2 NTAP Oct (20th) 80 puts while the weighted put-call ratio for NTAP remains on a sell signal.
- Retain the 2 EQR Oct (20th) 65 puts, bought when EQR closed below 64.50 on Aug 15th. Hold these as long as the weighted put-call ratio for EQR remains on a sell signal.
- While takeover rumors persist, keep the 3 X Sept (15th) 31 calls.
- Hold the 2 PSX Sept (15th) 115 calls amid activist investor rumors.
- Maintain mental closing stops for all positions unless otherwise noted.