Reflecting on One Year Since the Bear-Market Low
Not everyone is reaching for the champagne as we commemorate the first anniversary of the S&P 500’s bear-market low on Oct. 12, 2022. The significant rebound from the bear-market abyss on June 8, with a surge of more than 20% from the October low, has led to different opinions on whether this marks the beginning of a new bull market.
For some experts, the 20%+ surge from the October low backdated to June marked the inception of a new bull market. Others are waiting for the S&P 500 to surpass its previous high from January 2022 before bestowing the bull market label. And some are meticulous about meeting specific criteria before making any announcements.
Regardless, this anniversary offers an opportunity to assess how the stock market has performed since the bear-market low. Those inclined to categorize it as a bull market might not be celebrating the strongest start.
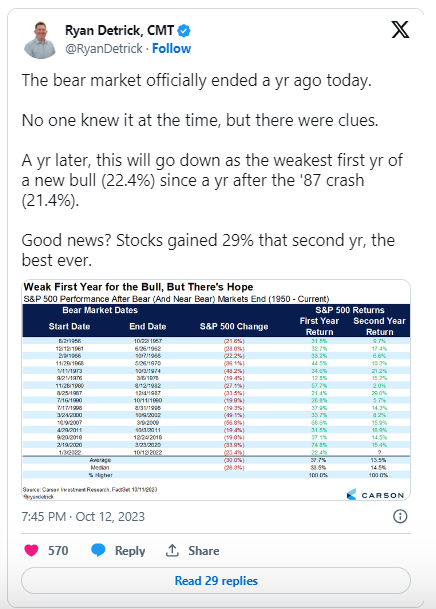
Ryan Detrick, Chief Market Strategist at Carson Group, highlights that the S&P 500’s 22.4% gain during its first year falls short of the median first-year gain of 33.5% based on data since 1956. Yet, there’s a bright side – the S&P 500 experienced a 29% surge in the second year of the post-1987 rally, marking it as the most vigorous.
Although the stock market has made efforts to stabilize, the S&P 500’s pullback of just under 10% from its 2023 high on June 30 casts a shadow. Some skeptics are concerned that the bull market may have already ended due to factors such as increasing interest rates, oil prices, bond yields, and the strengthening U.S. dollar.
Sam Stovall, Chief Investment Strategist at CFRA, emphasizes that each S&P 500 bull market since 1949 only came to a close after completely recovering from the previous bear market’s losses. The current bull has only retraced 83% of its decline.
Stovall’s conviction lies in the fact that there have only been three “bogus bulls” since World War II, and historical data shows that positive S&P 500 returns through September have led to full-year gains 96% of the time.
However, your perception of this bull market might depend on the company you keep. The stock-market rally is still primarily driven by a handful of mega-cap tech stocks. An equal-weighted measure of the S&P 500 indicates more moderate gains, just over 11% in the past year.
The chart below provides a glimpse of the top 25 best- and worst-performing stocks in the large-cap Russell 1000 index since October 12 last year:

On average, the stocks in the index have risen by about 15% over the year. However, the chart illustrates the winners surging by 90% or more, while the losers have fallen over 40%.
The question remains: Were you fortunate enough to own the big winners and dodge the big losers during this market journey?
John Paul is the founder of DayTradeToWin, a trading education and software company established in 2008, supporting traders worldwide. His expertise focuses on price action-based futures trading strategies and structured market analysis.
DayTradeToWin delivers trading education, indicators, and software tools designed to help traders apply disciplined, rule-based decision-making across global futures markets.
He is the creator of multiple trading methodologies, including the Sonic System, Atlas Line, and Trade Scalper, which help traders identify structured opportunities in markets such as the E-mini S&P 500 (ES), Nasdaq (NQ), crude oil (CL), and gold (GC).
Official website: https://daytradetowin.com