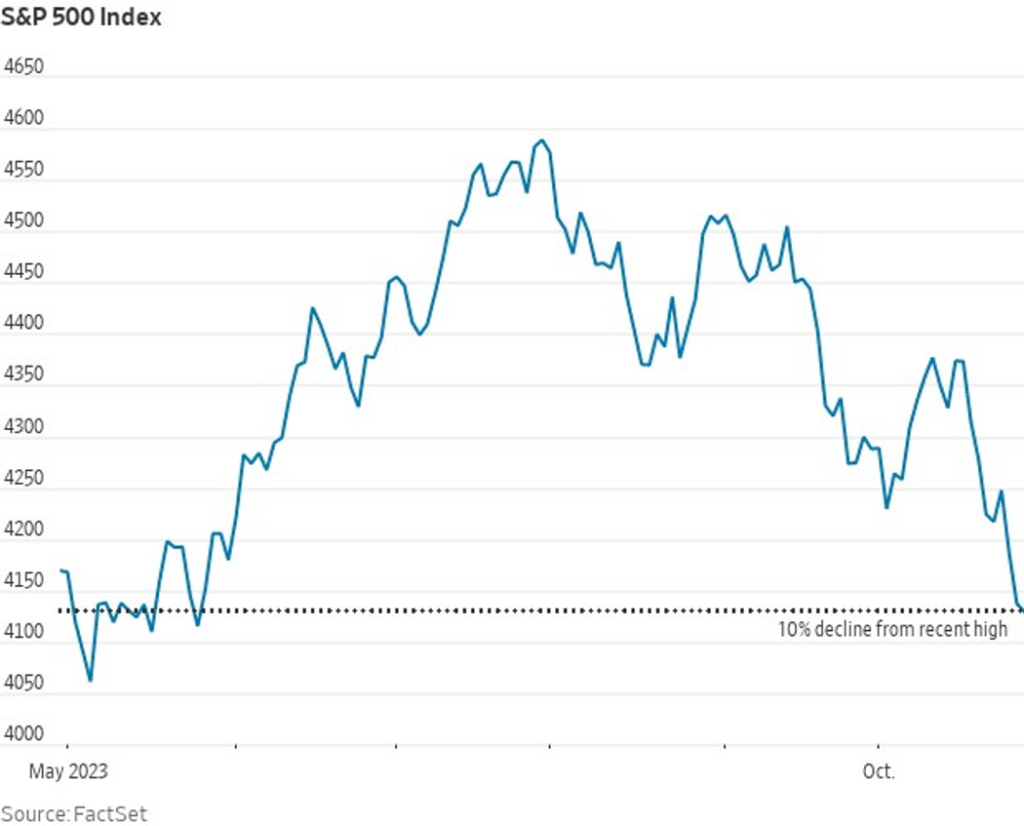
At the close of trading on Friday, the S&P 500 index entered correction territory, marking the 103rd instance in its history.
The S&P 500, a measure of U.S. large-cap equities, experienced a decline of 19.8 points, a 0.5% drop, reaching around 4,117 according to preliminary FactSet data. This decline reflects a 10.3% decrease from its prior cyclical high of 4,588.96 reached on July 31, 2023.
The Nasdaq Composite also transitioned into a correction phase last Wednesday.
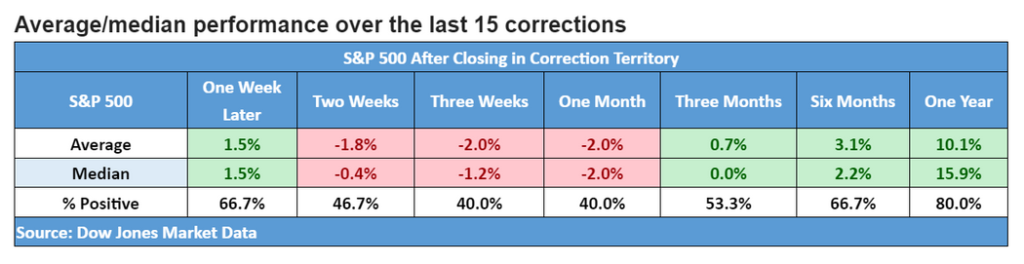
Reflecting on the past 15 corrections in the S&P 500, historical data shows it took an average of three months for the index’s performance to recover, with an average gain of 10.1% one year later.
Dating back to 1928, the S&P 500 has historically shown an average annual rise of 9.1% following a correction.
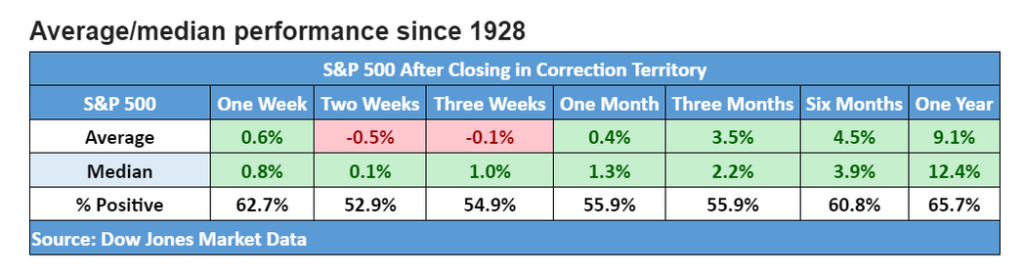
Market Data from Dow Jones
Despite these corrections, the S&P 500 has shown a 7.2% increase year-to-date. The Nasdaq Composite has surged by 20.8%, while the Dow Jones Industrial Average is down by 2.2% for the year, according to FactSet data.
John Paul is the founder of DayTradeToWin, a trading education and software company established in 2008, supporting traders worldwide. His expertise focuses on price action-based futures trading strategies and structured market analysis.
DayTradeToWin delivers trading education, indicators, and software tools designed to help traders apply disciplined, rule-based decision-making across global futures markets.
He is the creator of multiple trading methodologies, including the Sonic System, Atlas Line, and Trade Scalper, which help traders identify structured opportunities in markets such as the E-mini S&P 500 (ES), Nasdaq (NQ), crude oil (CL), and gold (GC).
Official website: https://daytradetowin.com