U.S. stocks were facing the potential for a technical pullback following a swift rally from October lows. However, the sudden downturn on Wall Street this Wednesday has led traders and analysts to consider whether more challenges lie ahead.
Examining numerous charts, Mark Arbeter, President of Arbeter Investments and a technical analyst, remarked, “Some Technology stocks are extremely extended, and many of the laggards from 2023 have also shown significant extensions after substantial recoveries. This leaves few appealing charts, at least in the short term,” as noted in a Thursday communication.
Arbeter added, “So, this was either a one-day wonder or the start of a decent pullback.”
On Wednesday, the Dow Jones Industrial Average (DJIA) experienced a substantial drop of 475.92 points, or 1.3%, marking its most significant one-day percentage decline since October 3. This ended a five-day streak of record highs. The S&P 500 (SPX), which had approached its January 3, 2022, record close, retreated 1.5%, closing just below 4,700—the most substantial percentage decline since September 26. Simultaneously, the Nasdaq Composite (COMP) saw a 1.5% drop, the largest since October 26.
Despite a partial recovery in all three major indexes on Thursday, Arbeter identified trendline support for the S&P 500 at 4,675, with the rising 21-day exponential moving average at 4,621. Stressing the significance of 4,600 as a crucial chart support level, he noted it marked the beginning of the last upside breakout.
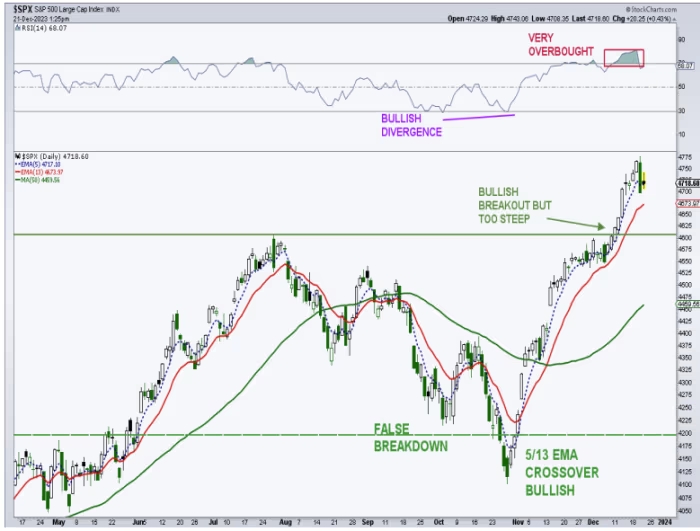
Both the Dow and Nasdaq had rallied for nine consecutive days before Wednesday’s setback. While the surge had rendered major indexes considerably overbought based on technical indicators, Arbeter noted that not all signs were pointing downward. Although price momentum and market breadth were extremely overbought, the absence of daily bearish momentum divergences and the continuation of strong breadth offered some positive indicators.
Arbeter highlighted that the percentage of S&P 500 stocks above their 50-day moving average had spiked to 91%, while the Nasdaq-100-tracking Invesco Trust QQQ Series ETF (QQQ) recorded a 95% reading on December 19.
Referring to historical data since the end of 2001, Arbeter mentioned that such “breadth thrusts” typically occur in the early or middle stages of a bull market, with a cautionary note on the exceptions in October 2007 and January 2018. Despite the likelihood of a near-term pullback, Arbeter expressed optimism about the bull market’s potential to continue based on price and breadth indicators.
John Paul is the founder of DayTradeToWin, a trading education and software company established in 2008, supporting traders worldwide. His expertise focuses on price action-based futures trading strategies and structured market analysis.
DayTradeToWin delivers trading education, indicators, and software tools designed to help traders apply disciplined, rule-based decision-making across global futures markets.
He is the creator of multiple trading methodologies, including the Sonic System, Atlas Line, and Trade Scalper, which help traders identify structured opportunities in markets such as the E-mini S&P 500 (ES), Nasdaq (NQ), crude oil (CL), and gold (GC).
Official website: https://daytradetowin.com