From History to Profit: Learning from the Best Trades of the Last 50 Years
In early Friday futures trading, there is a positive outlook for stock indices, and whether this optimism holds during Wall Street’s opening depends on labor market data.
Equity bulls prefer a U.S. nonfarm payrolls report indicating steady job growth and modest wage inflation, as it is less likely to deter the Federal Reserve from implementing a springtime cut in borrowing costs.
Investors currently enjoy positive momentum from well-received earnings reports by Meta Platforms (META) and Amazon.com (AMZN). However, a less favorable response to Apple’s (AAPL) numbers may temper this enthusiasm.
Once again, big tech plays a crucial role in boosting the market, but investors should refrain from assuming perpetual dominance, as the influence of U.S. tech does not guarantee continuous benefits from “American exceptionalism.”
Dan Suzuki, deputy chief investment officer at Richard Bernstein Advisors, cautions against such assumptions, noting that positioning and valuation suggest an expectation of perpetual U.S. equity dominance. However, historical patterns indicate otherwise, with high valuations and unrealistic growth expectations leading to disappointments and substantial devaluations.
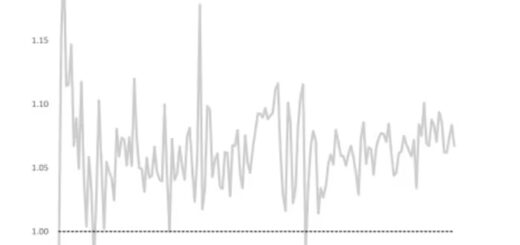
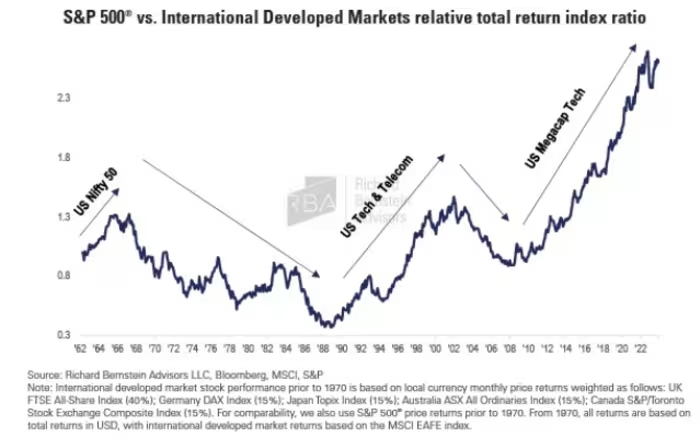
Suzuki emphasizes that periods of significant outperformance are often followed by notable underperformance. The chart below illustrates how sectors, even those with robust secular themes, can reverse much of their previously earned extraordinary gains.
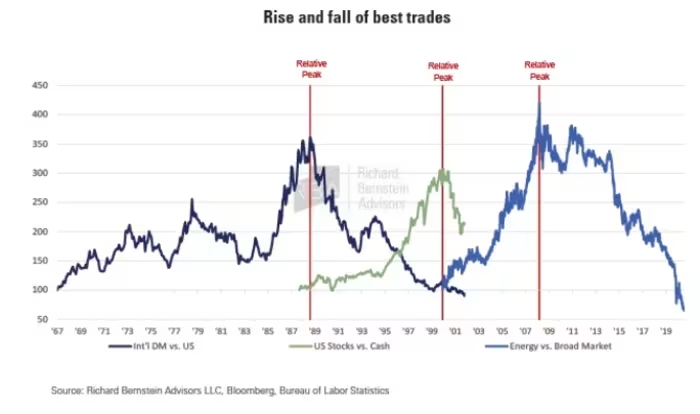
To underscore the cyclical nature of market trends, Suzuki identifies the best trades of the last 50 years. These trades generated excess returns averaging 7-19% per year over periods ranging from 8-22 years.
- International stocks over U.S. stocks (1967 – 1988): The dark blue line in the chart indicates the shift from dominant U.S. Nifty 50 large caps to international stock leadership, driven by the rise of efficient Japanese manufacturers.
- US stocks over cash (1987 – 2000): The green line reflects the climb of U.S. stocks after the 1987 market crash, with telecommunication and technology stocks taking the lead in the mid-1990s.
- Energy stocks over the broad market (2000 – 2008): The lighter blue line illustrates the outperformance of energy stocks due to strong emerging market growth outstripping supply after the bursting of the technology bubble and the great financial crisis.
- US stocks over cash (2009 – 2023): After the 2008 financial crisis, the U.S. stock market climbed another wall of worry, with low interest rates minimizing cash returns and boosting liquidity and investment demand for high-growth technologies.
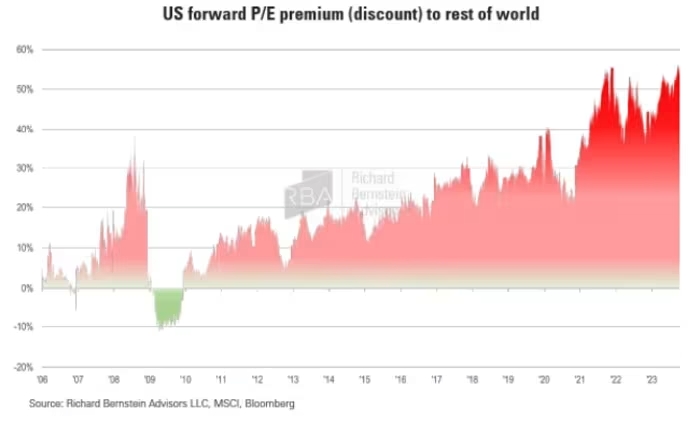
Suzuki warns that the current view of the U.S. as the only worthwhile investment is dangerous. Despite the U.S. share of the global stock market rising to 64%, and market concentration reaching unprecedented levels, investors need to be cautious. The U.S. is currently the most expensive compared to the rest of the world, with the premium having increased from -11% in 2009 to +60% today.
Rather than mitigating this extreme portfolio concentration, investors seem to be doubling down, with the average retail investor’s stock portfolio having 40% tied up in just three tech stocks.
Suzuki predicts the end of the current dominant trade, emphasizing that market leadership tends to shift in response to structural shifts in macroeconomic fundamentals. With major inflections across inflation, interest rates, globalization, corporate profitability, demographics, and government balance sheets, investors are facing a once-in-a-generation opportunity to rebalance portfolios.
In conclusion, Suzuki suggests that, with all eyes on U.S. large-cap growth stocks and disinflation beneficiaries, there are bigger opportunities in international markets, small caps, value stocks, and inflation beneficiaries.