
Unveiling the Classic Signs of a Stock-Market Bottom: JPMorgan’s Expert Tips
U.S. stock index futures are up early Tuesday following a significant decline on Monday that caused the S&P 500 to drop by 3%, marking its worst single-day performance in nearly two years. Over the past three sessions, the S&P 500 lost 6%, the Nasdaq Composite fell 8%, and the Russell 2000 plummeted 10%.
These declines are driven by fears of a U.S. recession and the Bank of Japan’s interest rate hike, which impacted the yen carry trade. The pressing question now is whether the worst is over for the market.
Thomas Salopek, head of cross-asset strategy at JPMorgan, believes the answer is no. He explains that the necessary conditions for a market bottom are not yet present.
Salopek identifies the pullback as “legitimate,” supported by widening credit spreads, a steepening Treasury yield curve, and the outperformance of utilities over the broader market. Factors like economic slowdowns or disinflation, which negatively affect other sectors, benefit utilities and defensive sectors that thrive on lower interest rates. “The growth outperformance of the second quarter suggested an economic slowdown while the third-quarter defensive leadership suggests growth risk,” says Salopek.
Salopek also questions the optimistic view of labor market data, which suggests that the rise in the unemployment rate is due to increased labor supply. “If that were the case, we would expect unemployment to stabilize, not continue to rise as it has,” he notes, adding that Hurricane Beryl affected the latest figures.
With the next jobs report a month away, investors need to focus on technical and risk-based signals, which are not indicating a market bottom, according to Salopek.
For instance, stocks rarely bottom when the VIX (the market’s fear gauge) is at its highs, although the VIX has dropped sharply in early Tuesday trading.
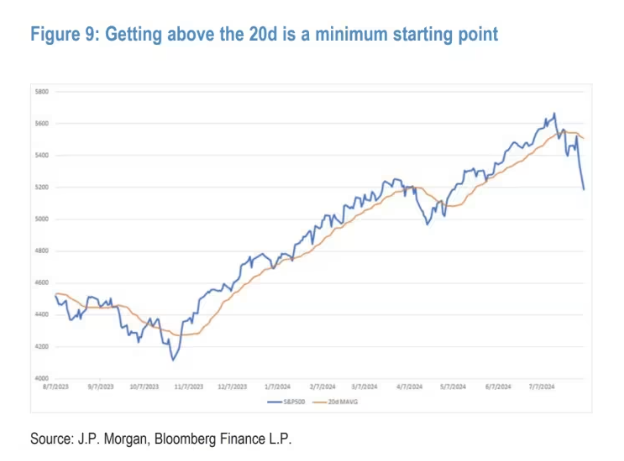
Additionally, the 20-day moving average’s slope does not provide reassurance, and crossing above it is “a minimum starting point.” He also notes that the put/call ratio typically peaks at market lows.
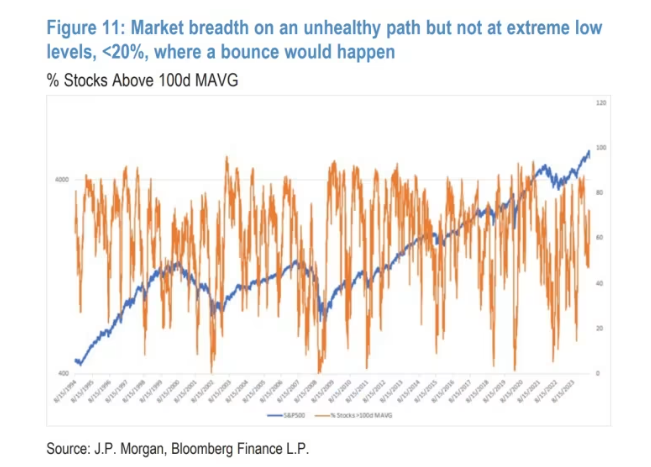
The percentage of Nasdaq stocks above their 100-day moving average is 34%, but Salopek would prefer this to drop to 20% before considering it closely. Similarly, the percentage of stocks at four-week lows is far from the 60% seen in previous corrections. He also monitors the American Association of Individual Investors sentiment survey, which sent a strong signal in fall 2022 when sentiment was worse than during the COVID crisis.
“Historically, a confluence of these bottoming signals during market corrections helps pinpoint the best time to re-enter,” Salopek says. For now, he recommends staying underweight in stocks and waiting for conditions to worsen enough to signal capitulation.