S&P 500 Slumps – Here’s What to Expect
The S&P 500 officially closed in correction territory on Thursday, marking its fastest peak-to-correction decline since March 2020.
Another day, another tariff-driven selloff on Wall Street.
The U.S. stock market’s sharp decline continued on Thursday, with the S&P 500 dropping 1.4% to close at 5,521.52. The index has now entered correction territory—defined as a 10% drop from its recent high—after falling more than 10% from its February 19 peak of 6,144.15.
This correction took just 16 trading days, making it the swiftest such decline since the six-day plunge at the onset of the COVID-19 pandemic in March 2020, according to Dow Jones Market Data.
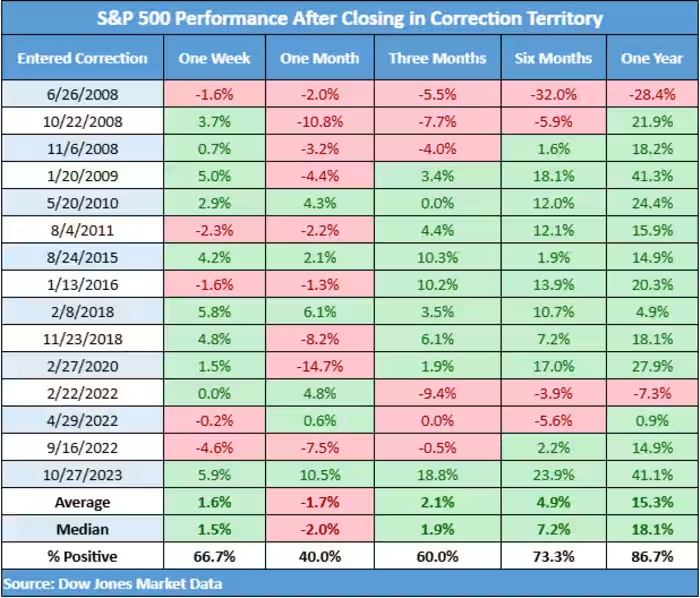
Market Performance After a Correction
Historical data suggests that stocks often struggle in the short term after entering correction territory but tend to recover over time. Since 2008, the S&P 500 has averaged a 1.7% decline in the first month following a correction. However, over the next three and six months, the index has historically rebounded by 2.1% and nearly 5%, respectively. One year after a correction, the S&P 500 has posted an average gain of 15.3%, according to Dow Jones Market Data.
Tariffs and Market Volatility
Thursday’s selloff was exacerbated by escalating trade tensions. President Donald Trump intensified tariff threats against the European Union, calling it a “hostile and abusive taxing and tariffing authority” and warning of a 200% tariff on EU alcohol imports. Meanwhile, Canada is embroiled in a tit-for-tat tariff dispute with the U.S., with Canadian Finance Minister Dominic LeBlanc and Ontario Premier Doug Ford meeting with U.S. Commerce Secretary Howard Lutnick to address trade tensions. The dispute stems from recent U.S. tariffs on steel and aluminum, along with previous threats of a 25% tariff on all Canadian goods.
The uncertainty surrounding Trump’s trade policies and retaliatory measures from global partners has fueled risk-off sentiment, increasing volatility and raising concerns about an economic slowdown.
Understanding Market Drawdowns
Despite the recent downturn, market experts suggest that such pullbacks are not unusual. Adam Turnquist, chief technical strategist at LPL Financial, noted that since 1950, 92% of trading days have experienced some level of drawdown from the S&P 500’s peaks. Declines of less than 5% occur in about 40% of cases, while pullbacks between 5% and 15% have taken place in over a quarter of all trading days.
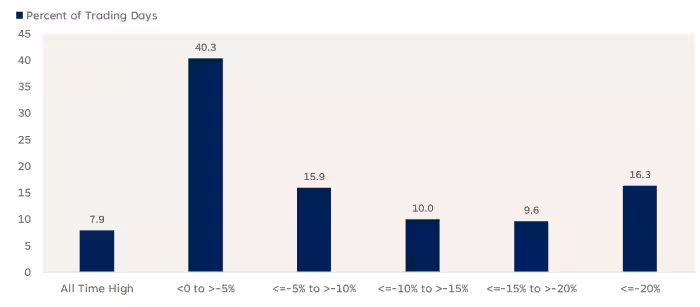
“Although this correction is sharp, it’s not out of the ordinary,” Turnquist explained. He pointed out that rapid selloffs often create oversold conditions, but ongoing market weakness, lack of institutional participation, and defensive sector rotations suggest caution when considering buying the dip.
Market Close and Outlook
On Thursday, U.S. stocks ended lower, with the Nasdaq Composite falling nearly 2% and the Dow Jones Industrial Average dropping over 530 points, or 1.3%, according to FactSet data. As investors navigate ongoing trade uncertainties, the focus remains on whether the market can stabilize in the coming weeks.