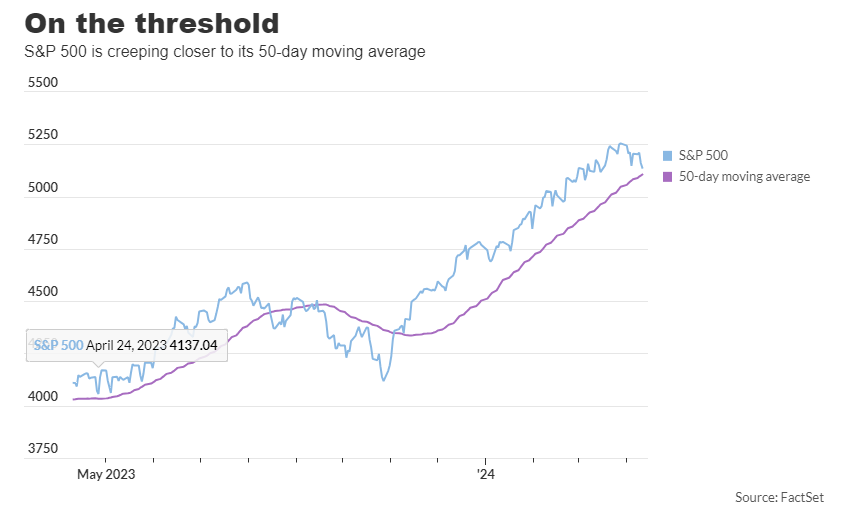
Thursday saw the S&P 500 coming within 33 points of its 50-day moving average, marking its closest approach since November 13th. This suggests a crucial juncture for the stock market rally, with recent volatility bringing the index within reach of a significant technical milestone not seen in five months.
A breach of this threshold could indicate further downside for stocks, potentially prompting a reversal of the rapid gains seen since late October. While some may view a minor pullback as healthy, the absence of any substantial correction for five months raises concerns.
Initially fueled by expectations of aggressive Federal Reserve interest rate cuts in 2024, the rally now faces skepticism due to hotter-than-expected inflation data. The narrowing gap between the S&P 500 and its 50-day moving average reflects the intensity of the rally, with the index trading well above this average for an extended period—the longest streak since 1998.
Despite a partial recovery on Thursday, with major indexes like the S&P 500 and Nasdaq Composite rebounding, the Dow Jones Industrial Average remains on track for a fourth week of losses in the past five.
Various technical indicators, including the 14-day relative strength index, suggest a loss of momentum for the S&P 500, although it still hovers around 1% below its recent record high.
Looking ahead, market technicians are closely monitoring the S&P 500’s movement relative to its 50-day moving average, currently standing at 5,105.73. A break below this level could signal further downside, with 4,990 identified as the next support level—a retracement of approximately 23% from the index’s recent rally peak. Katie Stockton of
Fairlead Strategies notes that such moving averages often align with significant support or resistance levels in the market.
John Paul is the founder of DayTradeToWin, a trading education and software company established in 2008, supporting traders worldwide. His expertise focuses on price action-based futures trading strategies and structured market analysis.
DayTradeToWin delivers trading education, indicators, and software tools designed to help traders apply disciplined, rule-based decision-making across global futures markets.
He is the creator of multiple trading methodologies, including the Sonic System, Atlas Line, and Trade Scalper, which help traders identify structured opportunities in markets such as the E-mini S&P 500 (ES), Nasdaq (NQ), crude oil (CL), and gold (GC).
Official website: https://daytradetowin.com