Following what appears to be the most challenging month for stocks this year, some investors are closely analyzing a chart that signals an impending showdown for the S&P 500 SPX.
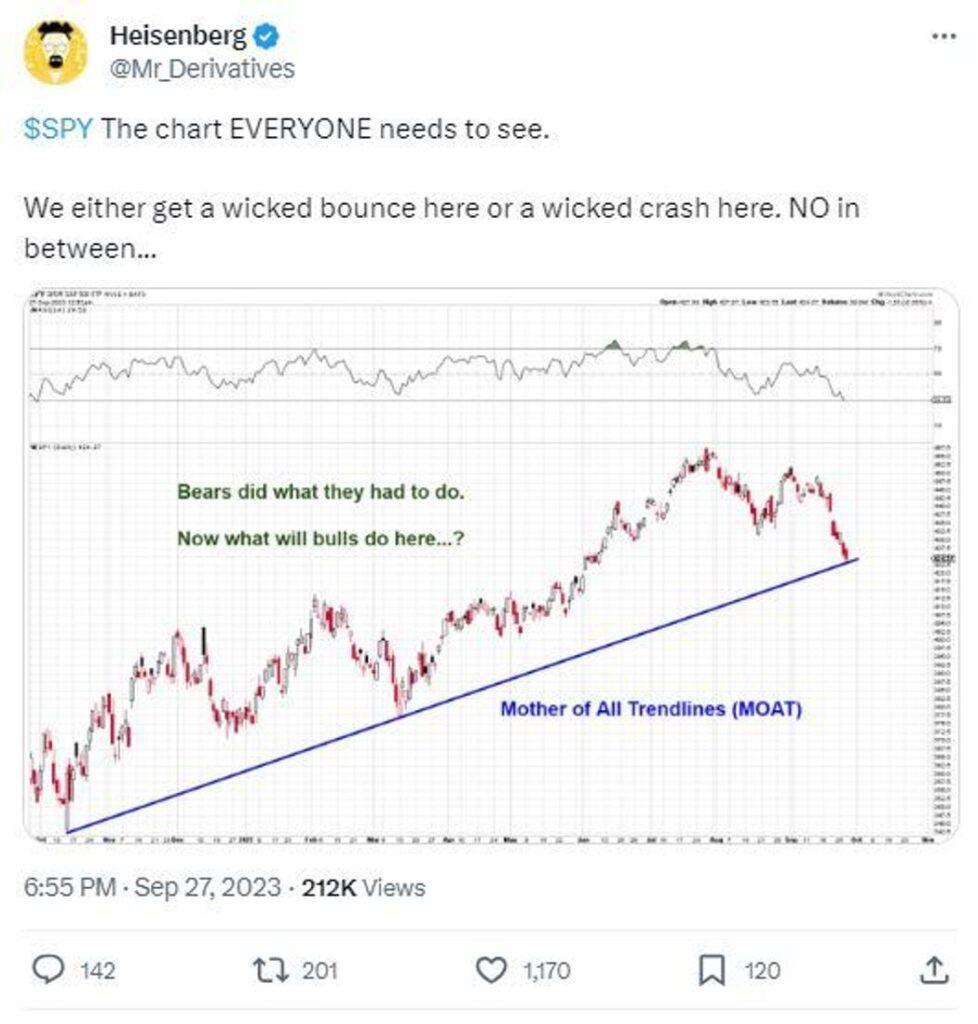
This chart was shared by a stock market commentator on X, known as Heisenberg, who goes by the handle @Mr_Derivatives:
The S&P 500 has experienced a 5.1% decline so far this month, following a 1.7% drop in August, which ended a streak of five consecutive months of gains. Rising bond yields and the possibility of higher interest rates in the coming year have significantly impacted high-performing tech stocks, leaving investors feeling apprehensive.
Other contributing factors to this decline include surging oil prices and concerns about potential slowing consumer spending, particularly as student loan payment moratoriums conclude. October is historically known as the most volatile month of the year.
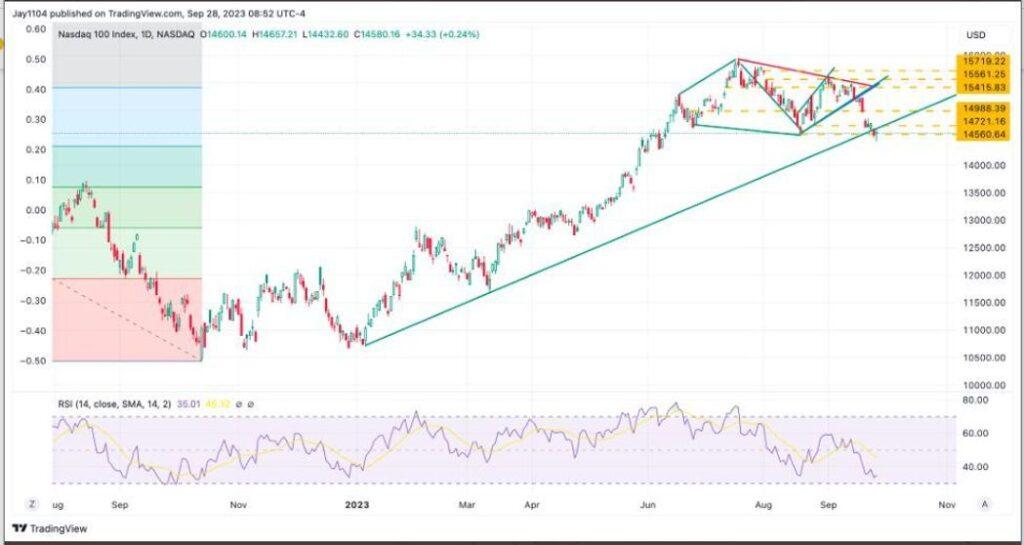
Michael Kramer, the founder of Mott Capital Management, emphasized that the chart represents a “major trendline stemming from the October lows.” He pointed out that the Nasdaq Composite has already broken a significant uptrend, which is a bearish sign, coupled with the presence of a head-and-shoulders and diamond reversal pattern.
The head-and-shoulders pattern often signals a shift from a bullish to a bearish market, while the diamond reversal pattern suggests a trend reversal following an extended period (learn more here).
Kramer’s chart illustrates how these patterns have affected the Nasdaq Composite, which has fallen by 6.7% in September, making it the worst month of 2023:
Kramer expressed skepticism about the next significant move for the S&P 500 off that trendline, stating, “If that breaks, we could see a sharp drop back to 4,100.”
He also highlighted the climbing 30-year Treasury yield (BX:TMUBMUSD30Y) as a critical factor. “If 4.8% breaks, there is no resistance until 5.4%,” potentially leading to more significant stock declines, including the Nasdaq-100 index (NDX) dropping to around 13,300 from its current 14,580. See his chart for reference:
Regarding the 10-year Treasury yield (BX:TMUBMUSD10Y), Kramer noted key resistance at 4.69%, with no significant resistance until it reaches 5.25%. He attributed the onset of market stress to changes in the Bank of Japan’s negative interest rate policy in July, allowing the 10-year JGB (BX:TMBMKJP-10Y) to rise to 1%. “This whole thing started after the July BOJ meeting,” he observed.
Kramer also pointed out international developments, referring to it as a “global reset.” The U.K. 10-year gilt yield (BX:TMBMKGB-10Y) surged from a low of 3.08% to 4.5%. He added, “Additionally, I think the market is saying the Fed policy is not restrictive enough.”
However, there might be a silver lining in the “mother of all trend lines” chart for the S&P 500, according to Adam Kobeissi from The Kobeissi Letter. He cautioned against assuming that if the trendline breaks, the entire market will collapse. Instead, he sees a different scenario.
“If that trendline holds, we should prepare for the next significant upward move,” Kobeissi suggested. Nevertheless, he acknowledged that the near-term trend has been leaning downward, with the S&P 500 establishing lower lows and lower highs.
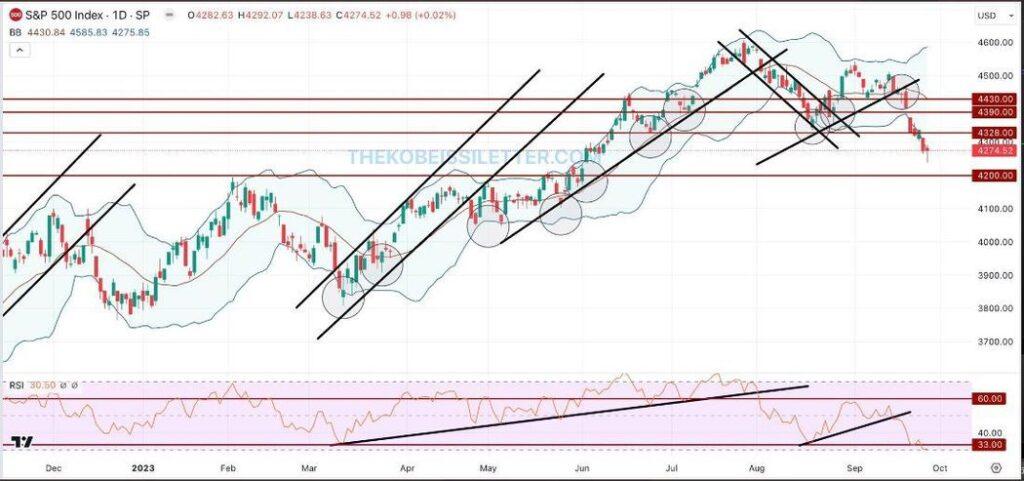
In his analysis, the 4,200 level is crucial support for the index, as it aligns with the high from February 2023. Kobeissi believes that the technical indicators are showing signs of being oversold and anticipates “some sort of a bounce in the 4200-4250 range, which may have already started yesterday, leading into 4335. A rejection of that level would form a lower high and open the door for new lows, while breaking above that level opens the path to 4400.
John Paul is the founder of DayTradeToWin, a trading education and software company established in 2008, supporting traders worldwide. His expertise focuses on price action-based futures trading strategies and structured market analysis.
DayTradeToWin delivers trading education, indicators, and software tools designed to help traders apply disciplined, rule-based decision-making across global futures markets.
He is the creator of multiple trading methodologies, including the Sonic System, Atlas Line, and Trade Scalper, which help traders identify structured opportunities in markets such as the E-mini S&P 500 (ES), Nasdaq (NQ), crude oil (CL), and gold (GC).
Official website: https://daytradetowin.com